Download
1 / 23
230 likes | 272 Views
1.1 Populations and Samples. Population Parameters and Sample Statistics Population Simple Random Sampling (3) Population Size. (1) Population Parameters and Sample Statistics Population. (2) Simple Random Sampling. “RAN#” key construct a random number table. Answer (for reference).

E N D
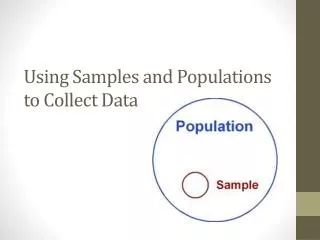
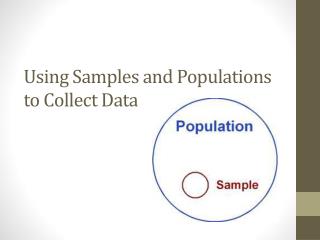
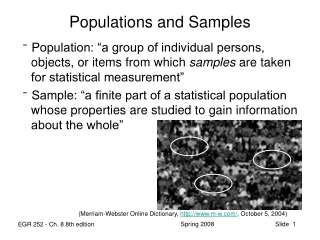
1.1 Populations and Samples Population Parameters and Sample Statistics Population Simple Random Sampling (3) Population Size
(2) Simple Random Sampling • “RAN#” key • construct a random number table
Answer (for reference) • 0.871 0.843 0.874 0.237 0.451 0.770 0.962 0.980 • 0.583 0.201 0.199 0.565 0.298 0.830 0.727 0.690 • 0.532 0.932 0.508 0.710 0.900 0.661 0.481 0.484 • 0.561 0.119 0.206 0.364 0.814 0.366 0.964 0.703
*Population Size • N is larger than or equal to 10. • *[Notice: Size of a population need not be large. ]
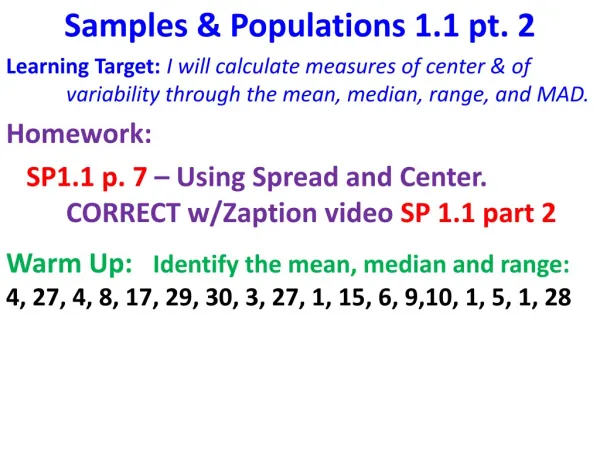
1.2 Central Tendency • mean • median • mode
1. mean • Population Mean for Ungrouped Data • Sample Mean for Ungrouped Data • Population Mean for Grouped Data • Sample Mean for Grouped Data • Combined Sample Mean • The Weighted Mean
2. median • Median of data arranged in order of magnitude • The median = • Median Found by Ungrouped Frequency Distribution • Median Found by Grouped Frequency Distribution
3.mode • In general, the mode of a set of data is the value which occurs most frequently in the set.
1.3 Measures of Dispersion (Dispersion and Varibility) • The Range • The Interquartile Range, the Five-number summary and box plots • The Variance and the Standard Deviation
1.The Range • The range of a set of data is the difference between the largest value and the smallest value of the set. • Example 1 Find the ranges of the following sets of data: • A = {40, 41, 42, 58,59,60} • B = {20,20.1,20.2,59.1,59.2,60} • C = {10,20,30,40,50,60,70} • The range of A = • The range of B = • The range of C =
2.The Interquartile Range, the Five-number summary and box plots • Lower Quartile Q1 value • Median Q2 value • Upper Quartile Q3 value • The Interquartile Range = Upper Quartile – Lower Quartile • = Q3- Q1
Example 6 • Find the interquartile range of the following set of numbers. 2,3,3,9,6,6,12,11,8,2,3,5,7,5,4,4,5,12,9
Example 7 • The table gives the cumulative distribution of the heights (in cm) of 400 children in a certain school: Find (i)Draw a cumulative frequency curve. (ii)Estimate the median. (iii)Determine the interquartile range.
x Minimum Q2 Q3 Q1 Maximum The Five-number summary and box plots • The format of Box and Whiskers diagram is shown below:
C.W. Q3 • The weekly expenditure on soft drinks of 20 football players re given in the following table: • Expenditure on soft drinks of 20 football players(in dollars) Find • Maximum value = • Upper quartile = • Median = • Lower quartile = • Minimum value = • and then draw the Box and Whiskers diagram
3.The Variance and the Standard Deviation • (I)Population variance and population standard deviation • (II)Sample Variance and Sample Standard Deviation
(I) Population variance and population standard deviation • Population variance, 2 = • Population Standard Deviation, =
(II) Sample Variance and Sample Standard Deviation • Sample Variance s2
Example 1 • Two machines, A and B, are used to pack biscuits. A sample of 10 packets was taken from each machine and the mass of each packet, measured to the nearest gram, was noted. Machine A(mass in g) 196,198,198,199,200,200,201,201,202,205 Machine B(mass in g) 192, 194, 195, 198, 200, 201, 203, 204, 206, 207 (i) Find the standard deviation of the masses of the packets taken in the sample for each machine. (ii)Comment on your answer.
C.W.mean ,standard deviation • The following are two sets of data of an experiment obtained by two different students:Volume of acid measured (cm3) • Student A 8,12,7,9,3,10,12,11,12,14 Student B 7,6,7,15,12,11,9,9,13,11 (i) What is the mean volume of acid measured by each student?(ii) What is the standard deviation?(iii) Which set of results is more reliable?