Download

1 / 11
120 likes | 385 Views
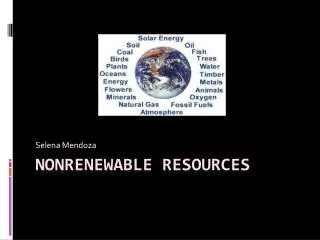
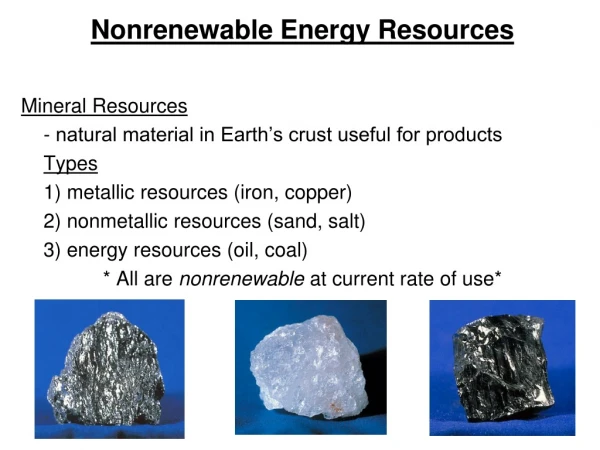
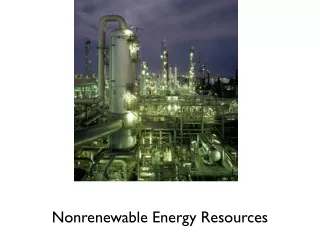
Nonrenewable resources depletion. History of oil use- 1. crude oil- when first discovered its rate of consumption was very low 2. Learned to separate it into products such as gasoline and kerosene.

E N D
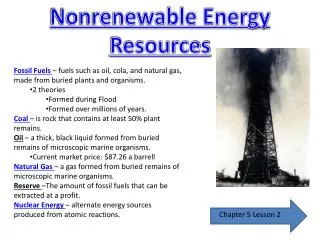
History of oil use- • 1. crude oil- when first discovered its rate of consumption was very low • 2. Learned to separate it into products such as gasoline and kerosene. • 3. Automobiles were invented that used gasoline and mass production made them available for everyone • 4. Gas demand caused oil production to increase • 5. Diesel locomotive, airplanes, trucks, heating oil, oil fired electric plants all added to the demand which grew exponentially History of oil
Resource depletion curve- a typical production cycle- example oil • 1. Since the earths resources are finite production will grow until it peaks and then decreases • 2. It will become harder to find and wells will have to be dug deeper and be located in more remote regions • a. This will be expensive and make it more difficult to make a profit • b. More companies will drop out of that business Depletion curve example oil
Resources are the amount of the material that is known to exist or is assumed to exist • 1. These are an estimate and often uncertain amount • 2 contain materials that may not be able to be extracted • Reserves- The amounts of the material that can be extracted profitably with existing technology • 1. from areas that have been studied and could be currently mined • 2. even these estimates change and material is extracted Resource vs reserve
Knowing the actual shape of the curve at the beginning of the curve and the estimate of the total quantity of the resource allows us to predict the depletion curve • Using this curve it has been estimated that 9o% the worlds crude oil will be gone by 2025 Depletion of oil
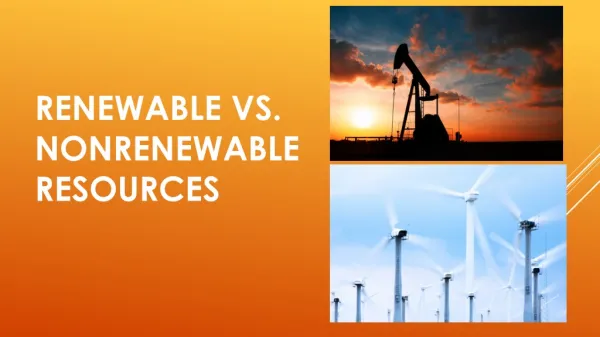
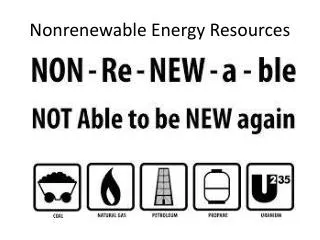
Coal • In the U.S. estimated 1.7 trillion tons • Crude oil • 175 billion barrels in the U.S. • Natural Gas • 1430 trillion cubic feet in the U.S. • Uranium • 455,000 tons in proven reserves ( enough to fuel 83 nuclear power plants for 30 years) How much do we have?
Life time of the resource • 1. depends on how much we have • 2. how fast we use it • Static lifetime- assumes that the rate doesn’t change and that there are no new reserves discovered. • Exponential lifetime- assumes that demand increases but reserves stay constant How long will our resources last?
How long will our reserves last • 1. hard to determine since we don’t know for sure how demand will change and if new reserves will be found • 2. New government regulations can change where resources can be extracted How long will our reserves last?
Things we can do to help • 1. continued exploration and improve extraction • 2. improve the efficiency of our machines to consume less resources • 3. improve quality of devices and reduce pollution • 4. expand the use of renewable energy sources • 5. examine new processes to limit wasteful consumption • 6. plant trees and conserve forests to help absorb CO2 Things we can do to help