Download
1 / 107
1.07k likes | 1.22k Views
Gonorrhea Prevention: Optimizing Strategies to Reduce Health Disparities. Kevin O’Connor, M.A. Chief, Program and Training Branch Division of STD Prevention Virginia DIS Training September 12, 2011. Division of STD Prevention.

E N D
Gonorrhea Prevention:Optimizing Strategies to Reduce Health Disparities Kevin O’Connor, M.A. Chief, Program and Training Branch Division of STD Prevention Virginia DIS Training September 12, 2011 Division of STD Prevention National Center for HIV/AIDS, Viral Hepatitis, STD & TB Prevention
Overview of Discussion • Why talk about gonorrhea now? • Epidemiologic trends • Health disparities • Drug resistant gonorrhea • Regional discussions on GC • GC Prevention Activities • Surveillance • Targeted Screening - public and private • Partner Services (multiple strategies) • Health promotion/risk reduction • The right strategies for your area?
Gonorrhea Overview Second most commonly reported STD Profound health disparities among African Americans Caused by a bacterium Neisseria gonorrhoeae Asymptomatic in most women and some men Symptoms: discharge from vagina or penis; and pain on urination. Most men have symptoms Complications: infertility, chronic pelvic pain, ectopic pregnancy If exposed, increased risk of HIV acquisition Easily treated with antibiotics?
HEADLINES YOU’LL NEVER SEE: Bono Responds to Gonorrhea Outbreak
- Profound health disparities - Antibiotic Resistance - Loss of fluoroquinolones and eventual emergence of cephalosporin-resistant GC - Opportunity for success? - GC identifies populations with multiple risks - learn from our historic successes - achieving success might not be that difficult Why talk about Gonorrheanow?
Gonorrhea—Rates, United States, 1941–2009 Rate (per 100,000 population) 500 400 300 200 100 0 1941 1946 1951 1956 1961 1966 1971 1976 1981 1986 1991 1996 2001 2006 Year
Gonorrhea case rates by sex, 1990–2010* * 2010 data are preliminary.
Status Quo 1000 new infections per day ~ 300,000 cases/year removing 1000 infections per day
Gonorrhea—Rates by State, United States and Outlying Areas, 2009 34.9 VT NH MA RI CT NJ DE MD DC 8.0 8.6 30.4 30.6 73.1 54.8 111.2 113.5 432.7 8.3 10.9 23.5 44.1 29.4 92.4 7.2 42.8 87.2 Guam 33.5 147.0 13.9 81.4 55.2 77.2 66.4 139.2 154.7 12.5 107.2 57.2 63.2 26.2 100.3 89.4 89.6 109.8 150.4 127.5 Rate per 100,000 population 128.3 50.0 156.2 185.7 54.5 246.4 141.3 160.8 <19.0 (n = 8) 120.4 19.1–100.0 (n = 24) 113.9 204.0 144.3 >100.0 (n = 22) Virgin Islands 104.7 Puerto Rico 5.8 49.0 NOTE: The total rate of gonorrhea for the United States and outlying areas (Guam, Puerto Rico, and Virgin Islands) was 97.8 per 100,000 population.
Gonorrhea—Rates by County, United States, 2009 Rate per 100,000 population <19.0 (n = 1,405) 19.1–100.0 (n = 1,129) >100.0 (n = 607)
Gonorrhea—Rates by Age and Sex, United States, 2009 Men Rate (per 100,000 population) Women 750 600 450 300 150 0 0 150 300 450 600 750 Age 10–14 5.0 25.3 15–19 250.0 568.8 20–24 407.5 555.3 25–29 238.9 229.4 30–34 145.0 106.2 35–39 85.6 47.6 60.8 22.9 40–44 45–54 33.6 8.7 2.1 11.4 55–64 65+ 2.7 0.5 Total 92.2 105.7
Gonorrhea—Rates by Race/Ethnicity, United States, 2000–2009 Rate (per 100,000 population) 800 700 600 500 American Indians/Alaska Natives Asians/Pacific Islanders 400 Blacks 300 Hispanics Whites 200 100 0 2000 2001 2002 2003 2004 2005 2006 2007 2008 2009 Year
Gonorrhea—Positivity Among Women Aged 15–24 Years Tested in Family Planning Clinics, by State, Infertility Prevention Project, United States and Outlying Areas, 2009 0.3 VT NH MA RI CT NJ DE MD DC 0.2 0.3 0.6 1.2 1.3 2.5 0.0 1.1 0.3 0.4 0.1 2.7 0.1 0.5 1.4 0.2 0.8 0.5 0.8 3.4 1.8 1.4 1.1 0.3 0.2 0.4 1.0 1.0 1.0 0.5 1.0 1.2 0.6 Positivity (%) 0.8 0.4 1.9 2.0 1.6 2.0 2.4 1.8 * (n = 4) 2.1 2.0 <1.0 (n = 24) 0.2 1.2 1.0–1.9 (n = 16) Virgin Islands 2.0 Puerto Rico 0.1 >2.0 (n = 9) 0.5 * States/areas not meeting minimum inclusion criteria. NOTE: Includes states and outlying areas that reported positivity data on at least 500 women aged 15–24 years who were screened during 2009.
After Cephalosporins: What Next? Penicillin (in increasing doses)gone Tetracyclines gone Spectinomycin gone Fluoroquinolones gone Oral cephalosporins going? Injectable cephalosporins (Ceftriaxone)
Reported gonorrhea and chlamydia test volume*:Infertility Prevention Project, U.S., 2000–2010 *Total number of valid tests (positive and negative)
Reported number of tests* (IPP), by year *Gonorrhea and chlamydia; positive and negative results only.
What’s going on withtesting and screening in the private sector???
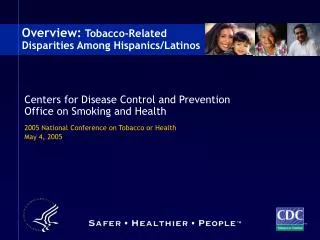
Percentage of sexually active female enrollees aged 16−25 years* who were screened for Chlamydia trachomatis infection, by health plan type and year - Healthcare Effectiveness Data and Information Set, United States, 2000-2007 MMWR, April 17, 200958(14);362-365 * 16-26 years during 2000-2002.
Gonorrhea positivity, women 15-24, family planning clinics, by race, Washington State IPP, 2007* *Data Source: Center for Health Training, Seattle WA
SSuN Population-based Gonorrhea Surveillance – Reported Risks over 3 Months by Gonorrhea Patients
“Heterosexual men and women with GC tend to be younger and African American, and to have minimal risk behaviors other than more than one partner. In contrast, MSM with GC reported a greater number of sex partners, more sex with anonymous partners, more sex with partners met on the internet, and more frequent drug use. Such data suggest two markedly different GC epidemics among heterosexuals and MSM.” Rietmeijer, et al, ‘Here Comes the Ssun’; PH Reports 2009 Supp. 2.; V. 124
National Gonorrhea Control Program Implemented in 1972 Federal funding to state and local agencies Establish screening programs for the detection of gonorrhea in asymptomatic women Screening facilities included public and private agencies Partner services
Gonorrhea—Rates, United States, 1941–2009 Rate (per 100,000 population) 500 400 300 200 100 0 1941 1946 1951 1956 1961 1966 1971 1976 1981 1986 1991 1996 2001 2006 Year I = Historic Gonorrhea Screening Program
National Gonorrhea Control Program 1973 Female ScreeningVD clinic Screening/testing 4,356,670 582,922 GC + 132,387 (3%) 109,889 (19%) Partner Services3 mos.Annual est. Interviews 64,154 ~259,000 (3 mos. only: April – June 1973) Contacts 61,439 ( 0.96 CI )Ct. examined 39,409 (~2/3) Infected/treated 15,928 (.40) ~64,000 Epi Rx 18,063
Historic GC Control ProgramCase Finding July 1972 – June 1973 STD Clinic Targeted Screening Partner Services 110,000* females ~ 13 % 64,000 ~ 7 % 132,000 females ~ 15% 842,000 Cases reported in 1973 * Includes GC contacts
GC Regional Meetings • Smaller meeting → more discussion • Learn from peers • Emphasize epi & program improvement • Accommodate regional similarities • Outcome: short-term Action Plans
Gonorrhea Control: Optimizing StrategiestoReduce Morbidity 1-day meetings held in each of the 10 HHS regions during 2009/2010
Anderson and May postulated that an STD will continue to spread in a community if the average probability of transmission per sex partner contact (times) the average duration of infection (times) the average number of sex partners per unit of time is greater than one. R0 = (ß x D x C) R0 -Average number of secondary cases generated in a population by a primary case ß - Average probability of transmission per sexual contact D – Averagedurationof infectiousness C - Average number of sexual partners per unit time What Guides the Level of Infection in a Community? Source: STDs, Holmes et. al. , 3rd Ed., 1999 Chapter 3. Roy M. Anderson
2001 CDC Consultation on Gonorrhea Recommendations for Programs Screening Partner services Access to care To view the Consultation report see resources at the ‘GC Control’ group at www.STDPreventionOnLine.org
Key Strategies: Surveillance Screening Treatment Partner Services Primary Prevention/risk reduction Community Engagement Key Health Care Providers
Gonorrhea—Rates by County, United States, 2009 Rate per 100,000 population <19.0 (n = 1,405) 19.1–100.0 (n = 1,129) >100.0 (n = 607)
Gonorrhea Rates among African Americans – Continental United States, 2008
Gonorrhea Cases by WI County 2008 1-100 101-1000 >1000 Wisconsin: 72 Counties Douglas 26 Bayfield Ashland Vilas 4 Iron Washburn 2 Sawyer 1 Burnett 3 Price Florence Oneida 3 Barron Rusk 1 Marinette 8 Polk 4 Forest 2 Lincoln 3 Langlade 1 Taylor Oconto 6 Chippewa 3 Dunn 5 St. Croix 9 Menominee 3 Marathon 26 Clark Pierce 1 Shawano 6 Eau Claire 10 2 Door Pepin Waupaca 2 Wood 6 Portage 5 Kewaunee 4 Buffalo Outagamie 67 Brown 294 Jackson 3 1 Trempealeau Winnebago 73 Manitowoc 12 Juneau 7 Waushara 4 6,062 = Total Cases Calumet 11 Monroe 16 LaCrosse 35 Adams 2 Marquette 1 Fond du Lac 44 1 GreenLake Sheboygan 20 Vernon Sauk 14 Columbia 14 Dodge 36 Richland 1 Ozaukee 19 21 Washington Crawford 1 Milwaukee --- 4,063 Dane 453 Waukesha 81 Jefferson 18 Iowa 2 Grant 7 Green 3 Racine – 277 Rock 134 Walworth 15 LaFayette 1 Kenosha ---- 160
Milwaukee City Zip Code Areas Zip Codes with Over 100 Reported Cases of GC in 2008: Zip Code – Number of Cases 53206 – 548 53209 – 402 53210 – 400 53212 – 390 53218 – 376 53216 – 333 53208 – 312 53225 – 175 53205 – 149 53204 – 127 53224 – 116 53233 – 115 These 12 zip codes represent 57% of all the gonorrhea reported in Wisconsin in 2008. Out of 4,032 cases reported from Milwaukee County in 2008 3,443 were reported from the 12 zip codes in the City of Milwaukee noted in the table – this represents 85.4% of the reported cases in Milwaukee County. (12/43 Zip Code areas in Milwaukee City)