Download
1 / 17
180 likes | 300 Views
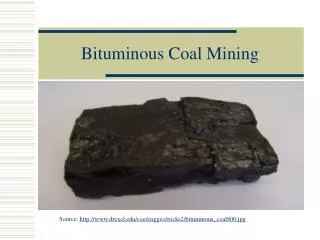
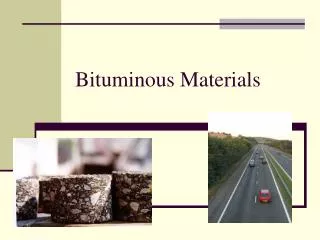
Fatigue damage of bituminous mixes. Sylvie Yotte et Mohsen Ech. Centre de Développement des Géosciences Appliquées Université de Bordeaux France. Contents. Pavement design and fatigue test Damage model Specimen simulation Test simulation Conclusion. Pavement design.

E N D
Fatigue damage of bituminous mixes Sylvie Yotte et Mohsen Ech Centre de Développement des Géosciences Appliquées Université de Bordeaux France
Contents • Pavement design and fatigue test • Damage model • Specimen simulation • Test simulation • Conclusion
Pavement design Fatigue cracking is one of the degradation mode of pavements Many laboratory fatigue tests exists Among them LCPC fatigue test (standard in France)
Fatigue test Trapezoidal specimen subjected to a two point bending test Specimen size : Bases : 25 mm and 56 mm – height : 250 mm
Simulation of the test • The stiffness loss is due to • An increase of temperature due to viscoelasticity • Thixotropy • Damage • Assumptions : • The temperature increase is neglected (stiffness loss of 3%) • Elastic damage (we are interested in the final state of the specimen)
Simulation of the test • Three parameters damage test • a1 = 50 – a2 = 5 – a3 = 3 • = 0,5 r = 4mm lc = 3mm ea is the weighted mean of the strain for elements which are within a circle of r radius of the examined element
Specimen simulation Scale : 1 mm = 1 pixel Image creation Image meshing
Specimen simulation gr3 gr2 gr1 aggregates 74.1 % 88.8% 90.1% deviation s=0.9% s=0. 8% s=1.3%
Simulation • 3 granulometries :
Results granulometry 1 Granulometry computed on the initial image Results of the simulation 16 specimens
Results granulometry 2 Granulometry computed on the initial image Results of the simulation 9 specimens
Results granulometry 3 Granulometry computed on the initial image Results of the simulation 8 specimens
Results granulometry 4 5 % of asphalt mastic element were weak : Eb = 9Mpa instead of 90 Mpa 9 specimens Results of the simulation
Discussion Granulometry does not explain the dispersion The introduction of 5 % aleas in the asphalt mastic phase increases the brittleness The model with the chosen parameters cannot modelize the localization Possible causes : There are more then 5% feeble points in the mastic phase. The damage program favors the damage on one side of the specimen Localization begins sooner in the second phase of the test
Perspectives • Identification method to set • Simulations with more aleas in the mastic phase • Healing simulation • Multiscale simulation