Download
1 / 12
150 likes | 304 Views
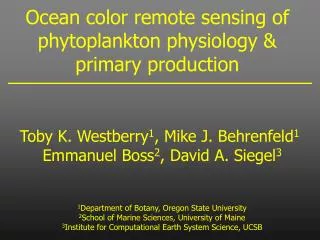
Carbon-Based Net Primary Production and Phytoplankton Growth Rates from Ocean Color Measurements. Toby K. Westberry 1 , Mike J. Behrenfeld 1 Emmanuel Boss 2 , David A. Siegel 3 1 Department of Botany, Oregon State University 2 School of Marine Sciences, University of Maine

E N D
Carbon-Based Net Primary Production and Phytoplankton Growth Rates from Ocean Color Measurements Toby K. Westberry1, Mike J. Behrenfeld1 Emmanuel Boss2, David A. Siegel3 1Department of Botany, Oregon State University 2School of Marine Sciences, University of Maine 3Institute for Computational Earth System Science, UCSB
Modelling NPP NPP ~ [biomass] x physiologic rate General NPP ~ [Chl] x Pbopt Chl-based NPP ~ [C] x m C-based Scattering (cp or bbp) Ratio of Chl to scattering (Chl:C)
0.080 0.013 0.065 0.011 0.050 Chl:C (mg mg-1) Chl:C (mg mg-1) 0.009 0.035 0.007 0.020 0.005 0.005 0 1 2 3 0 1 2 3 C-based approach • Scattering coefficients covary with particle abundance • (Stramski & Kiefer, 1991; Bishop, 1999; Babin et al., 2003) • Scattering coefficients covary with phytoplankton carbon • (Behrenfeld & Boss, 2003; Behrenfeld et al., 2005) • Chlorophyll variations independent of C are an index of • changing cellular pigmentation Satellite Laboratory Ig (Ein m-2 h-1)
CBPM In a nutshell • Invert ocean color data to estimate [Chl a] & bbp(443) • (Garver & Siegel, 1997; Maritorena et al., 2001) • Relate bbp(443) to carbon biomass (mg C m-3) • (Behrenfeld et al., 2005) • Use Chl:C to infer physiology (photoacclimation & nutrient stress) • Propagate properties through water column • Estimate phytoplankton growth rate (m) and NPP given: • PAR, Chl, K490, bbp(443), Zeu, MLD Carbon-Based Production Model (CBPM)
Depth-resolved CBPM PAR(z) z=0 Uniform (e.g., [Chl/C]sat) z=MLD Nutrient-limited &/or light-limited + photoacc. z=zNO3 Light-limited + photoacc. * Iterative such that values at z=zi+1 depend on values at z=zi *
~(1-e-3PAR(z)) Ik ~0.6 Light-limitation Index Ig (Ein m-2 h-1) CBPM details (2) 1. Let surface values of Chl:C indicate level of nutrient-stress -nutrient stress falls off as e-Dz(Dz=distance from nitracline) 2. Let cells photoacclimate through the water column - Iteratively calculate spectral attenuation 3. Account for light limitation Chl : C m (divisions d-1) Ig (Ein m-2 h-1)
CBPM details (3) INPUT (surface) OUTPUT ((z)) - SeaWiFS: nLw(l), PAR, Kd(490) - GSM01: Chl a, bbp(443) - FNMOC: MLD - WOA 2001: ZNO3 - Chl, C, & Chl:C - m - NPP Run with 1° x1° monthly mean climatologies (1999-2004)
Depth (m) Depth (m) Example profiles Eq. upwelling (0°N, -130°E, Aug) Eastern Pacific (20°N, -110°E, Jan)
This work VGPM (Chl-based model) ∫NPP (mg C m-2 d-1) ∫NPP (mg C m-2 d-1) NPP patterns(Jun-Aug) • large spatial & temporal • differences in carbon-based • NPP from Chl-based results • (e.g., > ±50%) • Chl-based model interprets high • Chl areas as high NPP • differences due to photo- • acclimation and nutrient-stress • related changes in Chl : C
Seasonal NPP patterns (N. Atl.) Western N. Atl CBPM VGPM Eastern N. Atl
Annual NPP • Although total NPP doesn’t change much (~15%), • where and when it occurs does
Example NPP profiles (HOT) - Uniform mixed layer (step function) v. in situ incubations - Discrepancies due to satellite estimates, NOT concept