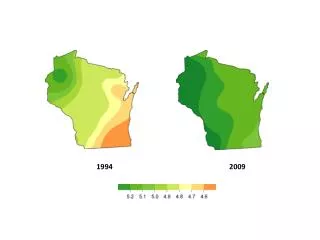
1 / 24

1994

1994. 1995. 1996. 1997. 1998. 1999. 2000. 2001. 2002. 2003. 2004. 2005. 2006. 2007. 2008. 2009. 2010. Major changes to the survey method in 2011 more detail at http://www.cdc.gov/surveillancepractice/reports/brfss/brfss.html. 2011. 2012. 2013. 2014. 2015. 1994. 2000.

victoria
Download Presentation

1994

An Image/Link below is provided (as is) to download presentation Download Policy: Content on the Website is provided to you AS IS for your information and personal use and may not be sold / licensed / shared on other websites without getting consent from its author. Content is provided to you AS IS for your information and personal use only. Download presentation by click this link. While downloading, if for some reason you are not able to download a presentation, the publisher may have deleted the file from their server. During download, if you can't get a presentation, the file might be deleted by the publisher.

E N D

Presentation Transcript


  1. 1994

  2. 1995

  3. 1996

  4. 1997

  5. 1998

  6. 1999

  7. 2000

  8. 2001

  9. 2002

  10. 2003

  11. 2004

  12. 2005

  13. 2006

  14. 2007

  15. 2008

  16. 2009

  17. 2010

  18. Major changes to the survey method in 2011 more detail at http://www.cdc.gov/surveillancepractice/reports/brfss/brfss.html

  19. 2011

  20. 2012

  21. 2013

  22. 2014

  23. 2015

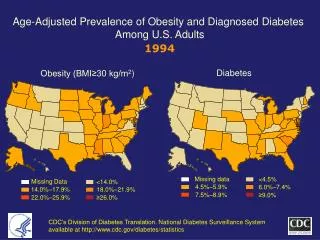
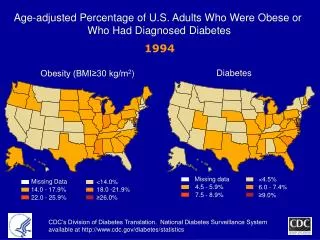
  24. 1994 2000 1994 2000 No Data <4.5% 4.5%–5.9% 6.0%–7.4% 7.5%–8.9% >9.0% No Data <14.0% 14.0%–17.9% 18.0%–21.9% 22.0%–25.9% > 26.0% Age-adjusted Prevalence of Obesity and Diagnosed Diabetes Among US Adults Obesity (BMI ≥30 kg/m2) 2015 Diabetes 2015 CDC’s Division of Diabetes Translation. United States Surveillance System available at http://www.cdc.gov/diabetes/data

More Related