Download
1 / 19
190 likes | 315 Views
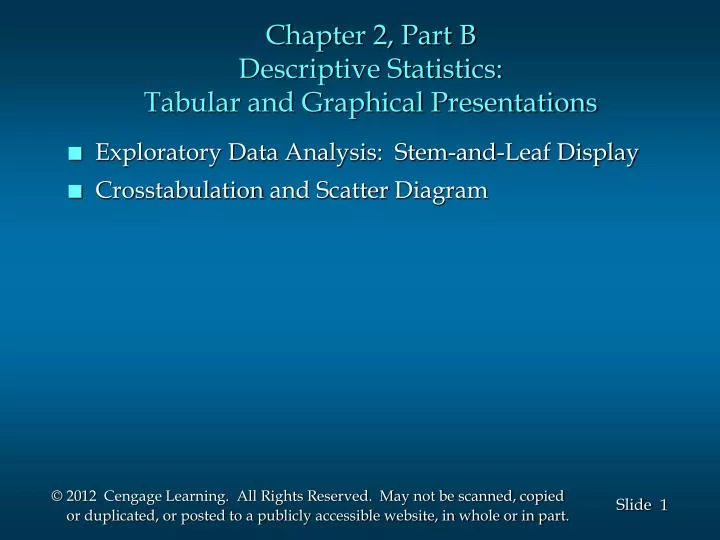
Chapter 2, Part B Descriptive Statistics: Tabular and Graphical Presentations. Exploratory Data Analysis: Stem-and-Leaf Display. Crosstabulation and Scatter Diagram. Crosstabulations and Scatter Diagrams. Thus far we have focused on methods that are used

E N D
Chapter 2, Part BDescriptive Statistics:Tabular and Graphical Presentations • Exploratory Data Analysis: Stem-and-Leaf Display • Crosstabulationand Scatter Diagram
Crosstabulations and Scatter Diagrams • Thus far we have focused on methods that are used • to summarize the data for one variable at a time. • Often a manager is interested in tabular and • graphical methods that will help understand the • relationship between two variables. • Crosstabulation and a scatter diagram are two • methods for summarizing the data for two variables • simultaneously.
Crosstabulation • A crosstabulation is a tabular summary of data for two variables. • Crosstabulation can be used when: • one variable is qualitative and the other is • quantitative, • both variables are qualitative, or • both variables are quantitative. • The left and top margin labels define the classes for • the two variables.
Crosstabulation • Example: Finger Lakes Homes The number of Finger Lakes homes sold for each style and price for the past two years is shown below. quantitative variable categorical variable Home Style Price Range Colonial Log Split A-Frame Total 18 6 19 12 55 45 < $200,000 > $200,000 12 14 16 3 30 20 35 15 Total 100
Crosstabulation • Example: Finger Lakes Homes Insights Gained from Preceding Crosstabulation • The greatest number of homes (19) in the sample • are a split-level style and priced at less than • $200,000. • Only three homes in the sample are an A-Frame • style and priced at $200,000 or more.
Crosstabulation Frequency distribution for the price range variable • Example: Finger Lakes Homes Home Style Price Range Colonial Log Split A-Frame Total 18 6 19 12 55 45 < $200,000 > $200,000 12 14 16 3 30 20 35 15 Total 100 Frequency distribution for the home style variable
Crosstabulation: Row or Column Percentages • Converting the entries in the table into row percentages or column percentages can provide additional insight about the relationship between the two variables.
Crosstabulation: Row Percentages • Example: Finger Lakes Homes Home Style Price Range Colonial Log Split A-Frame Total 32.73 10.91 34.55 21.82 100 100 < $200,000 > $200,000 26.67 31.11 35.56 6.67 Note: row totals are actually 100.01 due to rounding. (Colonial and > $200K)/(All > $200K) x 100 = (12/45) x 100
Crosstabulation: Column Percentages • Example: Finger Lakes Homes Home Style Price Range Colonial Log Split A-Frame 60.00 30.00 54.29 80.00 < $200,000 > $200,000 40.00 70.00 45.71 20.00 100 100 100 100 Total (Colonial and > $200K)/(All Colonial) x 100 = (12/30) x 100
Crosstabulation: Simpson’s Paradox • Data in two or more crosstabulations are often aggregated to produce a summary crosstabulation. • We must be careful in drawing conclusions about the • relationship between the two variables in the • aggregated crosstabulation. • In some cases the conclusions based upon an • aggregated crosstabulation can be completely • reversed if we look at the unaggregated data. The • reversal of conclusions based on aggregate and • unaggregated data is called Simpson’s paradox.
Scatter Diagram and Trendline • A scatter diagram is a graphical presentation of the • relationship between two quantitative variables. • One variable is shown on the horizontal axis and • the other variable is shown on the vertical axis. • The general pattern of the plotted points suggests • the overall relationship between the variables. • A trendline provides an approximation of the relationship.
Scatter Diagram • A Positive Relationship y x
Scatter Diagram • A Negative Relationship y x
Scatter Diagram • No Apparent Relationship y x
Scatter Diagram • Example: Panthers Football Team The Panthers football team is interested in investigating the relationship, if any, between interceptions made and points scored. x = Number of Interceptions y = Number of Points Scored 14 24 18 17 30 1 3 2 1 3
35 30 25 20 15 10 5 0 1 0 2 3 4 Scatter Diagram y Number of Points Scored x Number of Interceptions
Example: Panthers Football Team • Insights Gained from the Preceding Scatter Diagram • The scatter diagram indicates a positive relationship • between the number of interceptions and the • number of points scored. • Higher points scored are associated with a higher • number of interceptions. • The relationship is not perfect; all plotted points in • the scatter diagram are not on a straight line.
Using Excel’s Chart Wizard to Constructa Scatter Diagram and Trendline • Excel Worksheet (showing data)
Using Excel’s Chart Tools toConstruct a Scatter Diagram and Trendline