Download
1 / 30
300 likes | 306 Views
Climate Change and the European Water Dimension. A Report to the European Water Directors December 2004. Climate Change and the European Water Dimension. Global Climate Change and Water European Regional Climate Change and Water The General Hydrologic Cycle

E N D
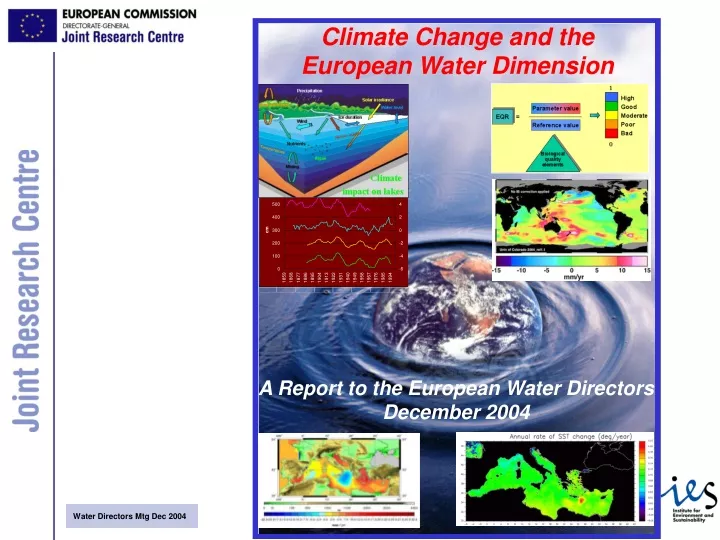
Climate Change and the European Water Dimension A Report to the European Water Directors December 2004
Climate Change and the European Water Dimension • Global Climate Change and Water • European Regional Climate Change and Water • The General Hydrologic Cycle • Climate Change and Aquatic Ecosystems • A. Proxy Indicators of Climate Change Forcing • B. Impact of Climate Change on Lakes • C. Impact of Climate Change on Coastal Ecosystems • D. Future of Mediteraanean Coastal Lagoons • Climate Change and Water Challenges • A. Climate Change and Extreme Events – Floods • B. Climate Change and Euroepan Droughts • C. Climate Change, Ecologcial Status and the WFD • D. Climate Change, Agriculture and Water • Case Studies • A. Climate Change and Lakes • B. Climate Change and the Venice Lagoon • C. Climate Change and River Basins • Ebro River, Po River • D. Climate Change and Hg Cycle • E. Climate Change and POPs • 2002 Elbe Flood and Dioxins • POPs Reservoirs – Soil-Air Exchange • References • VIII. Contributing Authors
Climate Change and the European Water Dimension Coordinating Author and Editor S.J. Eisenreich, JRC Ispra Italy Co-Authors P. Campostrini, A. De Roo, G. George, J. Hjorth, K.C. Jones, P. Noges, N. Hoepffner, N. Pirrone, N. Runnalls, F. Somma, G. Umlauf, P. Viaroli, J. Vogt, J.M. Zaldivar, Contributing Authors A. Algieri, G. Beaugrand. T. Blenckner, G. Bidoglio, F. Bouraoui, G. Cole, S. Cinnirella, S. Cornell, S. Demuth, M. Dokulil, G. Giordani, I. Hedgecock, A.-S. Heiskanen, C. Lavelle, T. March, B. Mostajir, S. Niemeyer, F. Raes, N. Reynard, G. Schmuck, D. Straile, J. Thielen, A. Tomasin, G. Trombino, W. Van De Bund
Impact of Europe’s Changing Climate: An Indicator-Based Approach European Environment Agency, EEA Rpt No.2/2004 (Oct, 2004) Impacts of a Warming Arctic Arctic Climate Impact Assessment of the Arctic Council Cambridge University Press, Nov. 2004 Climate Change and the European Water Dimension JRC and Water Directors Dec. 2004 Climate variability and change in Europe in the next 50 years will severely impact the quality and quantity of aquatic resources for human consumption as drinking water and availability of water in agriculture, increase the frequency of extreme events such as floods and droughts, and make policy adaptation very challenging. Ecological stability and functioning of aquatic ecosystems will diminish or at minimum be altered, and inland surface waters and coastal seas will undergo physical, biological and chemical changes and perhaps increased contamination due to altered biogeochemcial cycles of elements and pollutants.
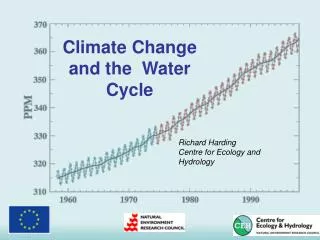
Figure I.4. CO2 Concentrations at Mauno Loa since 1958. (http://cdiac.esd.ornl.gov/trends/co2/sio-mlo.htm).
Climate Expectations Temperature will increase 0.1 to 0.4 0C per decade Biggest increase in Mediterranean region, Smallest increase in North Europe and Atlantic coast Summer warm up in southern Europe will be 2x faster than in north Precipitation will increase 1-2% per decade in north Europe Precipitation will decrease ~1% per decade in south Europe Winter precipitation will increase throughout Europe Summer precipitation will increase in north +2% per decade Summer precipitation will decrease in south –5% per decade Sea Level Rise of 13 to 68 cm by 2050
North Atlantic Oscillation from 1860 to 2000 Leads to changes in timing of ice out, intensity and timing of spring bloom, extreme events such as flooding and droughts, regional scale coincident events. Strong correlation of atmospheric POPs with variations in NAO over last decade (eastern Canada).
Hydromorphology Chemistry Physics Biology Lake area as % of country area – 0.1 to 9%
Figure IV.A.1 Cascading influence of the NAO from local meteorologytowards food-web interactions in Lake Constance (from Straile et al 2003)
Climate Change: An Overview and its Impact on the Living Lakes Hulme et al., 2003 (Tyndall Center)
Climate Forcing on Coastal Systems: Sea level rise Global Warming is responsible for thermal expansion of water, and a rise in sea level : present rate of 1-2 mm/yr ; future projection of 9 to 88 cm in 2100 (IPCC 2001) Impacts on the coastal areas • Increased Coastal Erosion • Extensive coastal flooding • Salinization of estuaries and land aquifers • Loss of nearshore habitats (salt-marshes, coral reefs, beaches..) • In addition to… • Socio-economic effects (loss of property, infrastructure damage…)
Trends in Sea Level (satellite altimetry) vary according to regional coastal systems: importance of downscaling models and statistics for proper assessment of the coastal response to climate change
Surface Ocean Temperature Trends 6 10 1 16 15 12 14
1982-2004 1993-1999 0.1 0C/yr 0.12 0C/yr Implications?
Satellite Detection of Increasing Dust Events over the Mediterranean Sea April 17, 2001 • Dust pixel classification • major dust with large particle • major dust with fine particle • minor dust with fine particle SeaWiFS (true colour Image)
Elbe River Flood 2002 Re-distribution of Contaminants - Dioxins
Behind broken dams Riverbanks • G. Umlauf: • Comparison of “Deichbruch” and “Deichvorland”: • High concentrations are present only in the riverbanks (historical contamination). • The samples from urban and agri areas flooded only in 2002 are in a range typical for urban areas. • Comparison with German guide lines for land use: • No action needed in zones flooded only in 2002 • Pasture land use on the riverbanks has to be critically reviewed. Guidelines are exceeded by up to a factor of 400.
Maximum Soil Reservoir Capacity for PCB-28 B. July A. January • POP Air concentrations with T and correlate with the NAO. • POP environmental reservoirs are large, primarly in soils and ocean waters. • Cycling through soil compartment via air-surface exchange and the effect • of soil OM and hydrology dramatically influence environmental fluxes. • Cycling of POPs via ocean-air exchange is linked to primary productivity • and OM fluxes. Jones, 2004
RBMP’s. Climate-induced changes in land use and land cover Typology of water bodies Typology criteria Type specific reference conditions Ecological quality assessment Classification borders and Intercalibration Emission limits and quality standards Economic analysis Water use and availability Aspects of WFD sensitive to Climate Change
In order to accommodate CC, RCshould not be constant but should change with a rate depending on overall changes of climate, and its impact on aquatic environments. (temperature, mixing patterns, turbidity, organic contents, light regime, etc.) Reference Conditions vs Climate Change
1 High Good Moderate Poor Bad EQR = Reference value 0 Ecological Quality Ratio Parameter value Biological quality elements (phytoplankton, aquatic flora, benthic invertebrates, fish)
Climate Change – what now? ADAPTATION · Identification and detection of signals of climate change in inland and coastal waters. · Development of indicators sensitive to climate variability and climate change Impacts on inland and coastal waters. · Development of guidance for EU water policy makers on the impacts to the water sector (agriculture, urban, industry, energy sectors, civil protection, spatial planning) under climate change scenarios. · Economic analysis of the costs of adapting to climate change in the water sector and analysis of the externalities of environmental systems under climate change impacts. SCENARIO MODELING Develop and apply Regional climate change scenarios at the river basin scale to assess response of land and water systems, and mitigation and scenarios, with associated costs.
WATER SECTOR: Quantify at the European and RB scale the impacts of climate change on water quality of surface and GW and water classification for RB management By coupling river basin-coastal zone models in a CC world. Quantify at the European and river basin scale the impacts of climate change on water quantity, its spatio-temporal distribution including extreme events such as floods and droughts, and availability of surface and ground waters under different scenarios and for different uses, and the associated costs of adaptation. Evaluation of the effectiveness of different protection measures (technical and environmental) in trans-national river basins with hydrological models as a response to possible increase in extreme events like floods and droughts through CC Evaluate the impacts of climate change on the re-mobilization and re-distribution of contaminants (chemical, microbiological) as a result of extreme events. MONITORING, VERIFICATION AND ASSESSMENT: · Perform long term monitoring at the pan-European scale using remote sensing EO of those parameters sensitive to climate change and variability. (SST, SLR, biomass, primary productivity, C cycling, wind fields, upwelling, trophic state)