Download

1 / 38
460 likes | 912 Views
Corporate Valuation Free cash flow approach. Firm Valuation—Disney. Disney has a normal valuation case…. Disney has positive earnings. Disney ’s earning has a positive growth rate. Disney ’s has sufficient financial information in estimating cost of capital. Firm Valuation—Disney.

E N D
Firm Valuation—Disney • Disney has a normal valuation case…. • Disney has positive earnings. • Disney’s earning has a positive growth rate. • Disney’s has sufficient financial information in estimating cost of capital.
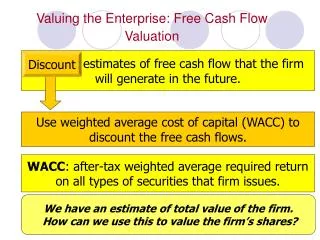
Firm Valuation—Disney The Strict View Dividends + Buybacks To Equity The Broader View Net Income - Net Cap Exp (1-Debt Ratio) - Chg WC (1 - Debt Ratio) = Free Cash flow to Equity Cash Flows EBIT (1-t) - ( Cap Exp - Depreciation) - Change in Working Capital = Free Cash flow to Firm To Firm
The growth rates in cash flows Net Income Retention ratio ROE g EPS Reinvestment rate ROC g EBIT Operating Income
Dividend growth, retention ratio, and Return on Equity (ROE)g = retention * ROEAssume that ROE=20%, payout=50%, beginning equity = 100
The growth rates in cash flows Expected Growth EBIT = Reinvestment Rate * Return on Capital Return on Capital = EBIT (1-t) / Capital Invested
Firm Valuation—Disney 1996 Disney’s basic data • EBIT:$5,559 Million • Capital spending:$ 1,746 Million • Depreciation:$ 1,134 Million • Non-cash Working capital Change:$ 617 Million • Book value of Debt:$7,763 Million (MV$11,180) • Book value of Equity:$11,668 Million (MV$50,880) • Levered Beta:1.25 • Risk free rate:7.00% • Risk Premium:5.50% • Tax rate:36%
Cost of Equity • Cost of Equity :k equity = 7.00% + 1.25*5.50% = 13.88% • Market Value of Equity = $50,880 Million • Equity/(Debt +Equity ) = 82%
Cost of Debt •Cost of Debt for Disney = 7.50% (From Moody’s Bond Rating) • After-tax Cost of debt = 7.50% (1-36%) = 4.80% • Market Value of Debt = $ 11,180 Million • Debt/(Debt +Equity) = 18%
WACC • WACC = 13.88% * 0.82 + 4.80% * 0.18 = 12.24%
1996 Free Cash Flow to the Firm • FCFF= EBIT (1 - tax rate) – (Capital Expenditures - Depreciation) – Change in Non-cash Working Capital =$5,559 (1-36%) – ($1,746-$1,134) –$617 =$2,329
The current growth rate for Disney • Reinvestment Rate1996 =(1745-1134+617) / 5559*(1-36%) =34.5% • ROC1996= 5559*(1-36%) / (7663+11668) =18.69% • Forecasted Reinvestment Rate=50% • ROC=20% • Expected Growth EBIT = 50% * 20% = 10%
How to determine a reasonable growth rate? • The firm is in stable growth • The firm is in a relatively high growth, will be in stable growth after certain years (2-stage) • The firm is in a high growth period, will experience a period of transition period before it is in stable growth (3-stage)
The high growth rates and high growth period • Very high growth rate in current time – long growth period • High entry barriers – long growth period • Large size of firm – short growth period
Relationship between growth rates and other firm characteristics
Disney’s Firm Valuation • Free Cash flows to Firm Approach • Three stages of growth
Terminal Value FCFF11 = EBIT11 *(1-t) – EBIT11* (1-t) *Reinvestment Rate = $ 13,539 (1.05) (1-36%) - $ 13,539 (1.05) (1-36%) (31.25%) = $ 6,255 million Terminal Value = $ 6,255/(10.19 %- 5%) = $ 120,521 million
Disney:Net Present Value Value of firm = $ 57,817 million Value of equity = Value of firm –Value of debt = $ 57,817 -$ 11,180 = $ 46,637 million Number of Shares =675.13 Value per share = 46637/675.13 = $69.08
Why we do not consider the cash flows related to the financing? • When you use the after-tax cost of capital to be the discount rate, you basically take in the effect of the financing. • If you discount the project cash flows (without financing) by the after-tax cost of capital, you will get the exact net present value as you use it to discount the total cash flows (project cash flows plus the financing cash flows). • That is, when you use the after-tax cost of capital to discount financing related cash flows, the net present value would be zero.
Assuming that financing totally comes from debt, and the before-tax cost of capital is 6%, tax rate 25%, so the after-tax cost of capital 4.5%.
How do managers create value? • Increase the cash flows generated by existing investments • Increase the expected growth rate in earnings • Increase the length of the high-growth period • Reduce the cost of capital that is applied to discount the cash flows.
Increasing the cash flows generated by existing investments • Managers can improve upon operating margin by improving operating efficiency and increase the returns to assets-in-place. • Tax management can also increase returns on existing assets. • Multinational firms can shift income across regions. • Net operating losses can shield future income. (Profitable firm acquires unprofitable firm) • Working capital management
Increasing the expected growth in FCFF or FCFE • Higher growth rates increase the value of the firm today. • The offsetting cost is that increasing the reinvestment rate can reduce costs today as it reduces FCFF and FCFE. • If reinvestment is NPV>0 project, then the benefits to growth outweigh the reduction on current cash flows. • Reinvest as long as EVA>0. • ROIC>rWACC
Reducing the cost of financing • Changing the financial mix of debt and equity can increase value. • Reduce tax liabilities by offsetting tax liabilities with interest payments. • Leads to an optimal capital structure for firm than lowers overall cost of capital and maximized firm value.
Adjusted Present Value (APV) Approach • APV = PV of asset flows + PV of side effects associated with the financing program. • Recall the M/M proposition I:
Adjusted Present Value (APV) Approach • Procedure: • 1. Calculate PV of project (or enterprise) assuming it is all equity financed (i.e. no interest expense) • 2. Calculate value of tax shield. • 3.Total firm value = value of all equity firm + side effects of financing.
Calculate PV of project assuming it is all equity financed • Assume: • Asset (un-levered) beta = 0.7 • Long Term T Bond Rate = 6% • Market Premium = 7.8% • From CAPM, Discount rate = .06 + .7*.078 = .1146 • Also assume: Terminal value = (approx.) 7 x FCF
Calculate value of tax shieldAssume: $150 of debt at 8% (pretax) remains outstanding
Compare tax payments with vs. without debt. The difference equals the tax savings available from the interest deduction (tax shield) Discount tax savings at pre-tax rate of return on debt:
Suppose in addition there is a tax loss carry-forward of $100 million. This means that the first $40 million of taxes need not be paid. Present value these savings at 8%, produces a value of 37 for the tax loss carry-forward.
APV - Conclusion Total firm value = value of all equity firm (295) + side effects of financing (13 + 37) = 345.