Download
1 / 26

E N D
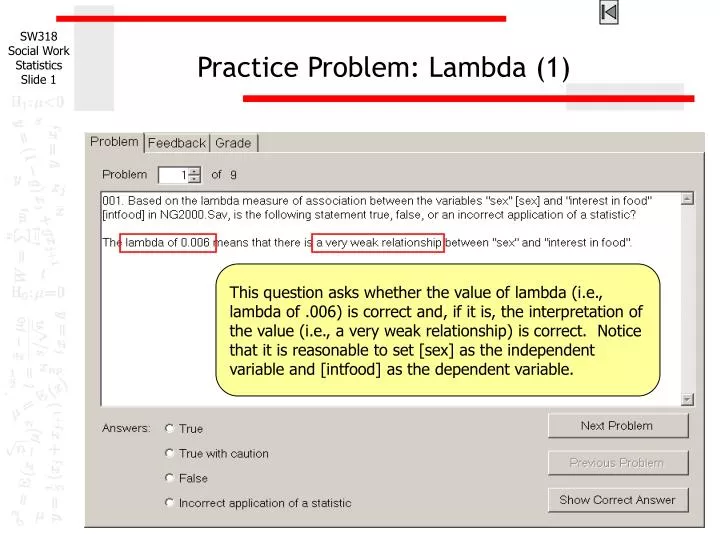
Practice Problem: Lambda (1) This question asks whether the value of lambda (i.e., lambda of .006) is correct and, if it is, the interpretation of the value (i.e., a very weak relationship) is correct. Notice that it is reasonable to set [sex] as the independent variable and [intfood] as the dependent variable.
Lambda in SPSS (1) In SPSS, you can obtain a lambda as an option in a crosstabulated table by clicking: Analyze > Descriptive Statistics > Crosstabs In other words, first, click on Analyze in the menu bar of SPSS, then find and click on Descriptive Statistics on a pop-down submenu. Again, find and click on Crosstabs on another pop-down submenu. Then, you will see a window shown in the next slide.
Lambda in SPSS (2) Select and move the independent and dependent variables to column and row sections, respectively. And click on Statistics button.
Lambda in SPSS (3) In Crosstabs: Statistics window, select Lambda option in the Nominal section. Then, click Continue and OK in the following window.
Lambda in SPSS (4) SPSS will provide with three tables after the command. You have to look at the last one named as “Directional Measures”.
Lambda in SPSS (5) Recall that lambda is an asymmetric measure of association. In other words, the measure of association value would vary depending on which variable is considered the independent variable (or dependent variable). Find a row labeled as Lambda and, then, “Interest in Food” [intfood] Dependent. The lambda with [intfood] as dependent variable is .006. Using the interpretive guide for measures of association (0.0 = no relationship, ±0.0 to ±0.2 = very weak, ±0.2 to ±0.4 = weak, ±0.4 to ±0.6 = moderate, ±0.6 to ±0.8 = strong, ±0.8 to ±1.0 = very strong, ±1.0 = perfect relationship), a lambda of .006 would be characterized as a very weak relationship.
Practice Problem: Lambda (2) This question asks about another way of interpreting lambda as a measure of association between two nominal variables. Recall that the lambda is a direct measure of proportional reduction of error (PRE), i.e., PRE=(E1-E2)/E1. Thus, the statement, “Information about survey respondents values of “sex” improves our predictions of their “interest in literature” by 13.2%,” means that the lambda with “sex” as the independent variable was .132.
Lambda in SPSS (7) The SPSS output shows that lambda value obtained with [intlit] as the dependent variable was .132. In other words, information about one’s gender [sex] helped us improve our prediction of the one’s “interest in literature” by 13.2%.
Practice Problem: Lambda (3) In SPSS output, you will often see a measure of association value of .000, which in fact can be any value less than .0005. Thus, it is UNLIKELY that the lambda of .000 actually means there is NO relationship between the two variables. It is advised to examine the cross-tabulation to confirm the findings from the lambda value.
Lambda in SPSS (8) From the lambda value of .000 obtained with “watching TV” as dependent variable, we could conclude that there was no association between “watching TV” and “sex”. However, remember that this interpretation needs some caution, which we will see in the next window.
Lambda in SPSS (9) There are 2 differences in column percentages greater than 5% in the crosstabulated table, suggesting that lambda may be understating the strength of the relationship between these variables.
Practice Problem: Gamma (1) The first step examining association between two variables is to identify the independent and dependent variables and the levels of measurement of those variables. Gamma as a measure of association is used between ordinal level variables or, possibly, dichotomous variables. For this example, the use of gamma was incorrect application of a statistic because the variable “marital status” is not an ordinal level variable but a nominal level variable and not a dichotomous variable either.
Practice Problem: Gamma (2) This question asks whether the value of gamma (i.e., gamma of .018) is correct and, if it is, the interpretation of the value (i.e., a very weak relationship) is correct. Notice that it is reasonable to set [sex] as the independent variable and [intfood] as the dependent variable.
Gamma in SPSS (1) In SPSS, you can obtain a gamma as an option in a crosstabulated table by clicking: Analyze > Descriptive Statistics > Crosstabs In other words, first, click on Analyze in the menu bar of SPSS, then find and click on Descriptive Statistics on a pop-down submenu. Again, find and click on Crosstabs on another pop-down submenu. Then, you will see a window shown in the next slide.
Gamma in SPSS (2) Select and move the independent and dependent variables to column and row sections, respectively. And click on Statistics button.
Gamma in SPSS (3) In Crosstabs: Statistics window, select Gamma option in the Ordinal section. Then, click Continue and OK in the following window.
Gamma in SPSS (4) On the Symmetric Measures table at the bottom of the output window, the SPSS output shows that the gamma between [rincom98] and [ethimp] is .018. Using the interpretive guide for measures of association (0.0 = no relationship, ±0.0 to ±0.2 = very weak, ±0.2 to ±0.4 = weak, ±0.4 to ±0.6 = moderate, ±0.6 to ±0.8 = strong, ±0.8 to ±1.0 = very strong, ±1.0 = perfect relationship), a lambda of .006 would be characterized as a very weak relationship.
Gamma in SPSS (5) Since the gamma was a positive value, survey respondents who had higher incomes attached greater importance to ethnic identity. However, the relationship between these variables was very weak. It can also be interpreted that information about survey respondents values for "income" improves our predictions of their "importance of ethnic identity" by 1.8% (i.e., gamma of .018).
Gamma in SPSS (6) In order for this problem to be true, gammas must be a positive number so that higher incomes are associated with greater importance of ethnic identity, and the size of gamma must fit the range of values associated with the adjective very weak.
Gamma in SPSS (7) Since the gamma was a positive value, survey respondents who had higher incomes attached greater importance to ethnic identity. In addition the value of gamma of 0.018 does fall within the range for describing a relationship as very weak. The answer to the question is true.
Steps in answering questions about lambda - 1 Question: what is the value and interpretation of lambda? • Does the value of lambda in SPSS and descriptive adjective agree with the problem statement? • Between 0 and ±0.20 - Very weak • Between ±0.20 and ±0.40 - Weak • Between ±0.40 and ±0.60 - Moderate • Between ±0.60 and ±0.80 - Strong • Between ±0.80 and ±1.00 - Very strong No False Yes True
Steps in answering questions about lambda - 2 Question: what is percentage improvement in predicting the dependent variable for lambda? Does the value of lambda in SPSS support the percentage improvement stated in the problem? No False Yes True
Steps in answering questions about lambda - 3 Question: does the lambda of 0.000 mean there is no relationship between the variables? Is the value of lambda computed by SPSS equal to 0.000? No False Yes Are the percentage differences within all rows of the crosstabs tables less than 5%? No True with caution Yes True
Steps in answering questions about gamma - 1 Question: what is the value and interpretation of gamma? Are both variables ordinal. Dichotomous, or interval? Incorrect application of a statistic No Yes Does the value or gamma, direction of the relationship, and descriptive adjective (0.0 = no relationship, +/-0.0 to +/-0.2 = very weak, +/-0.2 to +/-0.4 = weak, +/-0.4 to +/-0.6 = moderate, +/-0.6 to +/-0.8 = strong, +/-0.8 to +/-1.0 = very strong, +/-1.0 = perfect relationship) agree with the problem statement? No False Yes True
Steps in answering questions about gamma - 2 Question: is the statement of the relationship between variables correct? Are both variables ordinal. Dichotomous, or interval? Incorrect application of a statistic No Yes Does the sign of gamma support the direction in the problem statement (minus implies high on one, low on the other; plus implies high on one, high on the other)? No False Yes Does the value of gamma support the adjective describing the strength of the relationship in the problem? No False Yes Yes True
Steps in answering questions about gamma - 3 Question: what is percentage improvement in predicting the dependent variable for gamma? Are both variables ordinal. Dichotomous, or interval? Incorrect application of a statistic No Yes Does the value of gamma in SPSS support the percentage improvement stated in the problem? No False Yes True