Download
1 / 1
10 likes | 141 Views
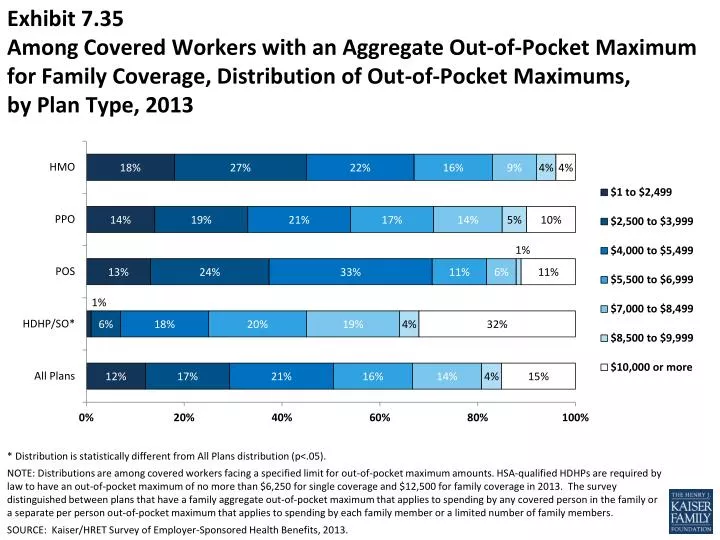
Exhibit 7.35 Among Covered Workers with an Aggregate Out-of-Pocket Maximum for Family Coverage, Distribution of Out-of-Pocket Maximums, by Plan Type, 2013. * Distribution is statistically different from All Plans distribution (p<.05).

E N D
Exhibit 7.35Among Covered Workers with an Aggregate Out-of-Pocket Maximum for Family Coverage, Distribution of Out-of-Pocket Maximums, by Plan Type, 2013 * Distribution is statistically different from All Plans distribution (p<.05). NOTE: Distributions are among covered workers facing a specified limit for out-of-pocket maximum amounts. HSA-qualified HDHPs are required by law to have an out-of-pocket maximum of no more than $6,250 for single coverage and $12,500 for family coverage in 2013. The survey distinguished between plans that have a family aggregate out-of-pocket maximum that applies to spending by any covered person in the family or a separate per person out-of-pocket maximum that applies to spending by each family member or a limited number of family members. SOURCE: Kaiser/HRET Survey of Employer-Sponsored Health Benefits, 2013.