Download
1 / 79
800 likes | 951 Views
Chapter 19 The Nature of the Stars. Figuring out what the rest of the Universe is like. Properties. Distance Parallax (triangulation) Spectroscopic parallax Properties from their Light temperature, luminosity, radius composition from spectrum variable stars Binaries

E N D
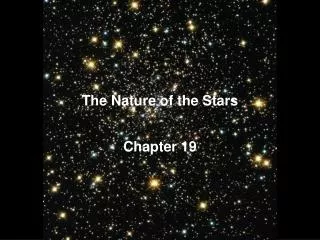
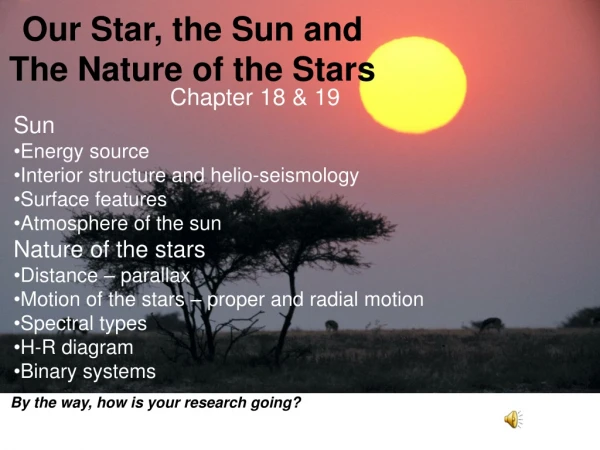
Chapter 19The Nature of the Stars Figuring out what the rest of the Universe is like
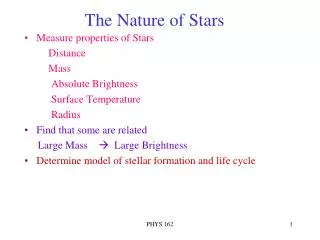
Properties • Distance • Parallax (triangulation) • Spectroscopic parallax • Properties from their Light • temperature, luminosity, radius • composition from spectrum • variable stars • Binaries • orbital properties and mass
The Sun is a typical Star • Stars are at a tremendous distance away from us, yet they are visible to us. • Therefore, the luminosity of stars (how much energy is emitted per second) must be comparable to our Sun. • Like our star, the only explanation for the source of the immense energy has to be Thermonuclear fusion reactions at the core.
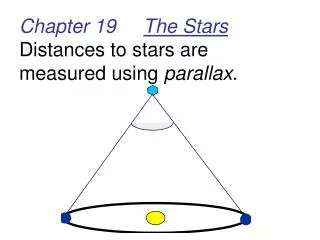
Measuring Distances to the Stars • It is not simple when comparing the luminosities of stars to know the distances to the stars. • A less luminous close by star may look brighter to us than a high luminosity far away star. • The most straightforward way of measuring distances to the stars is by using an effect known as parallax.
Stellar Parallax • Distance measured by looking at apparent change in location of star due to Earth’s actual change of location as it revolves around Sun. • only works for nearer stars. • Parallax forms base for other type of distance measurements. • Parsec: Distance of a star with parallax of one arc second = 3.26 light years.
Stellar Parallax P is the parallax angle
Stellar Parallax • Closer the star to us, the greater the parallax angle p.
Stellar Parallax • It is convenient to measure distance d to the stars in parsecs. • Parsec: Distance of a star with parallax of one arc second = 3.26 light years = 206,265 AU = 3.09 x 10¹³ km. • Relationship between parallax & distance • d = 1/p p = parallax angle in arc seconds d = distance in parsecs
Stellar Parallax • Parallax angles smaller than 0.01” are impossible to be measured on earth. • Most stars in the Galaxy are too far away to be measured by the parallax method. • But, the parallax measurements of the closer by stars are used as the basis of measuring the distances to remote stars.
Spectroscopic Parallax • Once the star is identified as a certain type of star (see stellar classification later) the brightness of this type of star is known. The apparent brightness of the star can be compared to the predicted brightness to get distance. • Second step in the “Distance Ladder”
Luminosity and Apparent Brightness Stars A & B of different luminosities can appear equally bright to an observer on earth if they are at different distances from Earth.
Luminosity and Apparent Brightness • Luminosity(L) = brightness of star (total energy radiated per second) measured in Watts • Intrinsic property of the star. • Apparent brightness (b) = Amount of energy per second enters through the area of a detector on Earth (eye, CCD chip, etc.). • Depends on the distance to the star
Luminosity and Apparent Brightness • Luminosity depends on • size of star • energy emitted per square meter (essentially temperature) • general rule: more massive = bigger radius =more luminous • luminosity decreases as inverse square of distance to star as energy from star is spread out over and ever larger expanding sphere.
Luminosity and Apparent Brightness • Inverse-Square Law between apparent brightness and luminosity • b = L/4d2 • b = apparent brightness in Watts/m2 • L = Star’s luminosity in Watts • d = distance to the star in meters • Doubling the distance makes the star look 22 = 4 times dimmer to someone on Earth.
Luminosity and Apparent Brightness • Astronomers use photometric measurements to find apparent brightness of stars, and find their luminosities from, • L = 4d2 b • Sun’s luminosity is given by L= 4d2 b • We know the values of d (Earth-Sun distance),L andb
Luminosity and Apparent Brightness • Determining a star’s luminosity from its apparent brightness: • L/ L =(d/ d)2 (b/ b) • L/ L = ratio of star’s luminosity to the Sun’s luminosity • d/ d = ratio of star’s distance to the Earth-Sun distance • b/ b = ratio of the star’s apparent brightness to the Sun’s apparent brightness Such calculations show that stars come in a variety of different luminosities. • From 106L to 10-4L
The Magnitude system • Magnitude indicates brightness • smaller magnitude (more negative) indicates brighter object • Apparent vs. absolute magnitude • Apparent magnitude(m): what we perceive • changed by distance from object • Absolute magnitude(M): magnitude of object at 10 parsecs distance from the Earth. • use this number to compare different stars
The Magnitude system • Relations between Apparent magnitude(m) and Absolute magnitude (M) • m - M = 5 Log(d) - 5 , where d is the distance to the star in parsecs • Apparent magnitude difference related to brightness (b) ratio • m2 - m1 = 2.5 Log(b1/b2) • (b1/b2) = 2. 512 m2 -m1
Measuring the temperature • Recall Wien’s Law: Color of hot object emitting spectrum is determined by temperature.
Star Spectra: A wealth of information • Temperature from peak wavelength • Composition from absorption/emission lines • Stars arranged into spectral classes • hottest to coolest temperatures • Doppler effect • Radial velocity (approach or receding) • Rotation period from Doppler effect
Star Spectra: A wealth of information • Like in our Sun, we see absorption line spectra in all the stars we observe. • These lines are created from light absorbed be a cooler layer of the stars atmosphere. • Spectra from different stars are extremely diverse. • to Cope with this diversity similar looking spectra are grouped into spectral classes.
Star Spectra: A wealth of information • The spectral classes ae identified by the letters: OBAFGKM. • Use the mnemonic: “Oh Be AFine Girl(Guy), Kiss Me” • Smaller steps to this spectral class scheme was added later: • Example: class F includes spectral types, F0, F1, F2, ……, F9. Same for other classes.
Star Spectra: A wealth of information • From the Bohr theory of the atom, we understand that the spectral lines are affected by the stars surface temperature. • Hot stars (much hotter than 10,000) do not have Balmer lines (O &B2 stars) because hydrogen atoms are ionized. • Cold stars (much colder than 10,000) do not have Balmer lines either(M0 & M2 stars) because the photons they emit do not have sufficient energy to excite electrons in H atoms.
Spectral Classifications • We can notice that Hydrogen line are absent in (fig. 19-11). • hot O and B2 stars • and cooler M0 and M2 stars. • Ca I & Fe I lines are strongest in G stars (like the Sun).
Star Spectra: A wealth of information • Previous graph shows the strength of different absorption lines: • The strengths depend on the temperature. • H lines are strongest in A0 - A5 stars - 7500 K - 10000 K • He II (singly ionized) lines are strongest in O stars-hotter than 30,000K. • Stars cooler than 10,000 K shows metal dominated spectra.
Stellar Sizes • Direct measurement - optical interferometry can resolve Betelgeuse’s disk - brighter closer stars. • Stellar sizes of most stars have to be measured using radiation laws: Using Luminosity (L) • Eclipsing binary light curve (see later).
Stellar Sizes • Stefan-Boltzmann law: L T4 • Luminosty surface area = 4(Radius)2 • Luminosity radius2 x Temp4 • L = 4R2T4 • L=Stars luminosity(energy radiated/sec) in W. • R = Radius of Star(m), T = Temp. of star(K) • = stefan- boltzmann constant
The HR diagram • HR = Hertzsprung - Russell • HR Diagram is handy way of plotting stars and seeing a pattern - the most important graph in astronomy. • x-axis: temperature (or stellar class) • y-axis: luminosity (brightness) in Solar units. • Information contained: • stellar evolution, radii, and masses (0.1 to 30 Msun)
The H-R diagram • Each dot is a star. • More luminous stars are at the top, and less luminous ones at the bottom • Hotter stats are to the left, cooler ones to the right.
The HR diagram • H-R diagram shows a relationship between temperature and Luminosity of stars. • Stars are not randomly scattered all over the H-R diagram, but are grouped in a few distinct regions. • 90% of the stars we see are grouped into a band - Main Sequence. • The stars in this band are called main sequence stars . The Sun is a main sequence star. • Hydrogen burning takes place inside the core.
The HR diagram • Main sequence stars: • Temp: 3000K - more than 30,000K • L ~ 10-4 L - 104 L • R ~ .1R - 10 R • Upper right hand corner shows the second group of stars - Red Giants (Ex: Aldebaran) • High luminosity & low temperature • Huge stars: R ~ 10R - 100 R • There are aFew stars having R ~ 1000 R • Supergiants (Ex: Betelgeuse in Orion )
The HR diagram • White Dwarf stars: 3rd group of stars • Very dim (0.04 L) but very hot (24,000 K) • Very small in size ( Size of Earth) • Glowing remnants of what once was a star. • Brown Dwarf stars: • Lie in the extreme lower right of H-R duagram • Comparable in size to Jupiter • Will never become a star. • Therefore, white dwarfs are “has been” stars and brown dwarfs are “never will be” stars.
A 10,000 K star could be a white dwarf, a main sequence star or a supergiant. • We need to look at the spectrum of stars to determine the category of the stars.
Luminosity classes and Spectroscopic parallax • How Luminosity affects a stars spectrum: • Compare spectra of two 13,400 K stars • (a) a B8 supergiant (Rigel - L =58000L) and (b) a B8 main sequence star (Algol - L=58000L)
Luminosity classes and Spectroscopic parallax • Atmospheres of Giants have low density & pressure, and hence produce thin absorption lines compared to main sequence stars. • Luminosity Classes: • Classification developed that is based on these subtle differences in spectral lines • When plotted on a H-R diagram these classes provide valuable subdivision of star types. • Different luminosity classes represent different stages in stellar evolution
Luminosity Classes • The spectral type of the Sun is a G2 V star. This indicates: L ~ 1.0 L &T ~ 5800 K • Aldeberan is a K5 III star: • L ~ 140 L & T ~ 4000K
Spectroscopic parallax • If we know a star’s spectral type (Ex: Sun - G2) and the luminosity class (ex: Sun - V), combined with the H-R diagram makes it possible to estimate the distance to the star. • Spectroscopic parallax. • This is a very powerful technique. Irrespective of how far the star is we can use this method to determine the distance - we only have to know its apparent brightness and its spectrum. • However, only accurate up to 10%