Download
1 / 90
900 likes | 1.03k Views
Louisiana Insurance Market Overview: Toward Viable Insurance Markets in the Post-Katrina & Rita Era. Louisiana Legislative Women’s Caucus Workshop on Insurance & Economic Development New Orleans, LA January 27, 2007. Robert P. Hartwig, Ph.D., CPCU, President & Chief Economist

E N D
Louisiana Insurance Market Overview:Toward Viable Insurance Markets in the Post-Katrina & Rita Era Louisiana Legislative Women’s Caucus Workshop on Insurance & Economic Development New Orleans, LA January 27, 2007 Robert P. Hartwig, Ph.D., CPCU, President & Chief Economist Insurance Information Institute 110 William Street New York, NY 10038 Tel: (212) 346-5520 Fax: (212) 732-1916 bobh@iii.org www.iii.org
Presentation Outline • Louisiana Insurance Market Overview • Recap of 2005 Hurricane Season • Louisiana Claim Detail: Hurricanes Katrina & Rita • 2007 Hurricane Season Preview • Catastrophes & Insurer Financial Strength • Overview of the National Flood Insurance Program • Insurance Industry Financial Overview & Outlook • The Role of Reinsurance Markets & New Challenges • Review of National Catastrophe Plan Proposals • Katrina Tort Update: Compounding the Uncertainty • Summary of Florida Special Legislative Session on Insurance • Many Steps in the Wrong Direction
Louisiana InsuranceMarket Facts • LA P/C insurance premium volume in 2005 was $7.70 billion, or 1.61% of the US total of $478.5 billion • LA Homeowners insurance premium volume in 2005 was $1.01 billion, or 1.75% of the US total of $57.5 bill. • Insured Katrina & Rita homeowners losses of $12.7 billion in LA were nearly 13 times the 2005 premiums of $1.01 billion • In MS, HO losses wiped out 17 years of premiums • The 2005 hurricane losses in homeowners insurance wiped out 25 years of premium and every dollar of profit ever made in the history of the state in this line • Homeowners insurers in LA had earned profits of only $17.3 million, including investment income, since 1985. Source: Insurance Information Inst. from National Underwriter Highline annual statement database; PCS.
Louisiana & Mississippi Market Shares, All Lines & Homeowners ALL LINES ($ Billions) HOMEOWNERS ($ Millions) LA accounts for less than 2% of the US insurance market but 51% of 2005 hurricane losses Source: Insurance Information Institute from National Underwriter Highline annual statement database.
Top 10 Major Disaster Declaration Totals By State: 1953- 2006* Total Number From 1953-2006*, Louisiana ranked fourth in the country in major disaster declarations *Through July 12, 2006. Source: Federal Emergency Management Agency (FEMA)
Total Value of Insured Coastal Exposure (2004, $ Billions) Louisiana had $209 billion in insured coastal property exposure in 2004, 7th highest of any hurricane exposed state Source: AIR Worldwide
Value of Insured Residential Coastal Exposure (2004, $ Billions) Louisiana had $88 billion in insured residential coastal property exposure in 2004 (42% of all LA coastal exposure), 7th highest of any hurricane exposed state Source: AIR
Value of Insured Commercial Coastal Exposure (2004, $ Billions) Louisiana had $121 billion in insured commercial coastal property exposure in 2004 (58% of all LA coastal exposure), 7th highest of any hurricane exposed state Source: AIR
Insured Coastal Exposure as a % of Statewide Insured Exposure (2004, $ Billions) Louisiana coastal exposure accounts for 37.9% of all insured exposure statewide, 6th highest of any state Source: AIR Worldwide
2005 Was a Busy, Destructive, Deadly & Expensive Hurricane Season All 21 names were used for the first time ever, so Greek letters were used for the final storms 2005 set a new record for the number of hurricanes & tropical storms at 28, breaking the old record set in 1933. Source: WeatherUnderground.com, January 18, 2006.
2006 Hurricane Season: Much Less Active Than Expected What a difference a year makes! Just 10 tropical cyclones (9 named) in 2006 vs. 28 in 2005! Source: WeatherUnderground.com, January 26, 2007.
Inflation-Adjusted U.S. Insured Catastrophe Losses By Cause of Loss, 1986-2005¹ Insured disaster losses totaled $289.1 billion from 1984-2005 (in 2005 dollars). Tropical systems accounted for nearly half of all CAT losses from 1986-2005, up from 27.1% from 1984-2003. 1 Catastrophes are all events causing direct insured losses to property of $25 million or more in 2005 dollars. Catastrophe threshold changed from $5 million to $25 million beginning in 1997. Adjusted for inflation by the III. 2 Excludes snow. 3 Includes hurricanes and tropical storms. 4 Includes other geologic events such as volcanic eruptions and other earth movement. 5 Does not include flood damage covered by the federally administered National Flood Insurance Program. 6 Includes wildland fires. Source: Insurance Services Office (ISO)..
Top 10 Deadliest Hurricanes to Strike the US: 1851-2005 Hurricane Katrina was the deadliest hurricane to strike the US since 1928 *Could be as high as 12,000 **Could be as high as 3,000 ***Midpoint of 1,000 – 2,000 range ****Associated Press total as of Dec. 11, 2005. *****Midpoint of 1,100-1,400 range. Sources: NOAA; Insurance Information Institute.
Number of Homes Destroyedby Major Hurricanes* Katrina appears to have destroyed 10 times as many homes as Andrew in 1992 or the 4 storms to hit Florida and the Southeast in 2004 *Destruction is defined as a structure made uninhabitable or damaged beyond economic repair. Source: National Association of Home Builders, National Red Cross (as of 9/15/05).
Insured Loss & Claim Count for Major Storms of 2005* Hurricanes Katrina, Rita, Wilma & Dennis produced a record 3.3 million claims *Property and business interruption losses only. Excludes offshore energy & marine losses. Source: ISO/PCS as of June 8, 2006; Insurance Information Institute.
Top 10 Most Costly Hurricanes in US History, (Insured Losses, $2005) Seven of the 10 most expensive hurricanes in US history occurred in the 14 months from Aug. 2004 – Oct. 2005: Katrina, Rita, Wilma, Charley, Ivan, Frances & Jeanne Sources: ISO/PCS; Insurance Information Institute.
HurricanesKatrina & Rita:Louisiana Insured Loss Claim Detail
Hurricane Katrina Insured Loss Distribution by State ($ Millions)* Louisiana accounted for 62% of the insured losses paid and 56% of the claims filed Total Insured Losses = $40.579 Billion *As of June 8, 2006 Source: PCS division of ISO.
Hurricane Katrina Loss Distribution by Line ($ Billions)* Total insured losses are estimated at $40.579 billion from 1.7438 million claims. Excludes $2-$3B in offshore energy losses *As of June 8, 2006 Source: PCS division of ISO.
Hurricane Katrina Claim Count Distribution by State* Louisiana accounted for 62%of insured losses paid and 56% of claims filed Total # Claims = 1,743,800 *As of June 8, 2006 Source: PCS division of ISO.
Hurricane Rita Claim Count Distribution by State* Louisiana accounted for 48.3% of the insured losses, Texas 44.6%. Excludes offshore energy losses of $2-3B Total # Claims = 383,000 *As of June 8, 2006 Source: PCS division of ISO.
Hurricane Rita Loss Distribution, by Line ($ Millions)* Total insured losses are estimated at $5.0 billion (excl. offshore energy of $2-$3B) from 383,000 claims. *As of June 8, 2006 Source: PCS division of ISO.
LA: Average Cost per Claim by Type of Claim and Storm* Commercial (business) claims are about 10 times more expensive than homeowners claims on average. Katrina HO claims 22% more expensive than Rita. *As of February 8, 2006 Source: PCS division of ISO.
Hurricane Katrina Claim Status on Storm’s 1st Anniversary* 95% of the 1.2 million homeowners insurance claims in Louisiana & Mississippi are settled, with just 2% in dispute *Hurricane Katrina made its north Gulf coast landfall August 29, 2005. Source: Insurance Information Institute survey, August 2006.
Katrina’s Path of Destruction Through the Offshore Energy Industry Katrina (& Rita) tore through offshore facilities Source: “Hurricane Katrina: Profile of a Super Cat,” RMS, October 2005.
Katrina & Rita: Total Energy Losses, Onshore vs. Offshore* Total = $9.15 Billion Total = $5.89 Billion Billions Source: Willis, Energy Market Review, May 2006. *Loss estimates are total losses, not just insured losses.
Government Aid After Major Disasters (Billions)* Hurricane Katrina aid will dwarf aid following all other disasters. Congress may authorize $150-$200 billion ultimately (about $400,000 for each of the 500,000 displaced families). Is the incentive to buy insurance and insure to value diminished? Within 3 weeks of Katrina’s LA landfall, the federal government had authorized $75B in aid—more than all the federal aid for the 9/11 terrorist attacks, 2004’s 4 hurricanes and Hurricane Andrew combined! $29B more was authorized in Dec. 2005. At least $80B more is sought. *In 2005 dollars. Source: United States Senate Budget Committee, Insurance Information Institute as of 12/31/05.
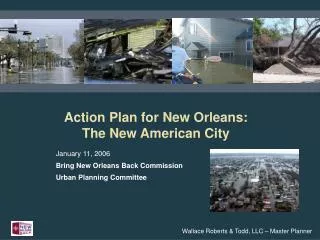
Spending on Hurricane Katrina Reconstruction (Through Dec. 2006) Only a fraction of promised government relief has reached the hands of those affected Source: Wall Street Journal, January 27, 2007, p. A1.
Outlook for 2007 Hurricane Season: 40% Worse Than Average *Average over the period 1950-2000. Source: Dr. William Gray, Colorado State University, December 8, 2006.
Probability of Major Hurricane Landfall (CAT 3, 4, 5) in 2007 *Average over past century. Source: Dr. William Gray, Colorado State University, December 8, 2006.
Landfall Probabilities by Region & Intensity, 2007* Landfall probabilities and intensities up everywhere (59%) (79%) (68%) (52%) (84%) (97%) (42%) (30%) (60%) (83%) (50%) (44%) (31%) (61%) (81%) *Figures in parentheses represent averages over the past 100 years. Source: Dr. William Gray, Colorado State University, December 8, 2006.
Number of Major (Category 3, 4, 5) Hurricanes Striking the US by Decade 1930s – mid-1960s: Period of Intense Tropical Cyclone Activity Mid-1990s – 2030s? New Period of Intense Tropical Cyclone Activity 10 Tropical cyclone activity in the mid-1990s entered the active phase of the “multi-decadal signal” that could last into the 2030s Already as many major storms in 2000-2005 as in all of the 1990s *Figure for 2000s is extrapolated based on data for 2000-2005 (6 major storms: Charley, Ivan, Jeanne (2004) & Katrina, Rita, Wilma (2005)). Source: Tillinghast from National Hurricane Center: http://www.nhc.noaa.gov/pastint.shtm.
Average Annual Tropical Cyclone Insured Losses, 20th Century*(Top 10 States, $ Millions) Distribution of Annual Losses *Normalized losses adjusted for inflation, housing density, wealth and wind insurance coverage, based on historical data for 100-year period 1900-1999. Source: Tillinghast-Towers Perrin
FINANCIAL STRENGTH & MEGA-CATASTROPHESIs There Causefor Concern?
Reasons for US P/C Insurer Impairments, 1969-2005 2003-2005 1969-2005 Deficient reserves, CAT losses are more important factors in recent years *Includes overstatement of assets. Source: A.M. Best: P/C Impairments Hit Near-Term Lows Despite Surging Hurricane Activity, Special Report,Nov. 2005;
The Flood Insurance Purchase & Retention DecisionFlood Insurance is a Tough Sell
Total Claim Payments by State (Top 11) Jan 1, 1978 - Feb. 2006 Louisiana and Mississippi rank 1st and 4th respectively in terms of total claims payments (up from 3rd and 11th pre-Katrina). Florida ranks 2nd and Texas 3rd. Source: FEMA, National Flood Insurance Program (NFIP)
Flood Insurance Penetration Rates:Top 25 Counties/Parishes in US* LA parishes have among the highest flood coverage penetration rates in the US (12 of the top 75) *As of 12/31/05. Source: New Orleans Times-Picayune, 3/19/06, from NFIP and US Census Bureau data.
Flood Insurance Penetration Rates:Counties/Parishes Ranked 26-50* Mid-Atlantic/Northeast Counties are underrepresented People along the eastern seaboard have not gotten the message *As of 12/31/05. Source: New Orleans Times-Picayune, 3/19/06, from NFIP and US Census Bureau data.
Flood Insurance Penetration Rates:Counties/Parishes Ranked 51-75* MS coastal counties rank abysmally low Barnstable is only county in all of New England among Top 75 *As of 12/31/05. Source: New Orleans Times-Picayune, 3/19/06, from NFIP and US Census Bureau data.
NFIP Flood PolicyPenetration Rates, by Region Flood is more commonly purchased in the South, but many still forego coverage *Special Flood Hazard Areas. Source: The National Flood Insurance Program’s Market Penetration Rate: Estimates and Policy Implications, RAND, 2006.
Flood Insurance Retention Rates,March 2005-February 2006 Flood insurance retention rates are a problem. Program lapse rate is too high. Customer acquisition is expensive. Source: FEMA/NFIP web site accesses 5/8/06: http://www.fema.gov/business/nfip/statistics/stats.shtm.
Factors Influencing NFIP Flood Penetration Rates • Price • Change in Price • Number of Homes in a Community’s Special Flood Hazard Area (SFHA) • Mandatory purchase requirements less vigorously enforced in communities with fewer structures in SFHAs • Questions about enthusiasm in selling or knowledge of agents regarding program • Coastal Flooding Potential • Penetration rate much higher for coastal communities subject to flooding versus those that are not (63% vs. 35%) • Mandatory Purchase Requirement Source: The National Flood Insurance Program’s Market Penetration Rate: Estimates and Policy Implications, RAND, 2006.
P/C Net Income After Taxes1991-2006E ($ Millions)* Though up in 2006, insurer profits are highly volatile (2001 was the industry’s worst year ever). ROEs generally fall below that of most other industries. • 2001 ROE = -1.2% • 2002 ROE = 2.2% • 2003 ROE = 8.9% • 2004 ROE = 9.4% • 2005 ROE= 10.5% • 2006 ROAS1,2 = 13.4% *ROE figures are GAAP; 1Return on avg. surplus. 2005 ROAS = 9.8% after adj. for one-time special dividend paid by the investment subsidiary of one company. 2Based on 9-month results; Sources: A.M. Best, ISO, Insurance Information Inst.
ROE: P/C vs. All Industries 1987–2008E P/C profitability is cyclical, volatile and vulnerable Sept. 11 Hugo Katrina, Rita, Wilma Lowest CAT losses in 15 years Andrew Northridge 4 Hurricanes *2006-8 P/C insurer ROEs are I.I.I. estimates. Source: Insurance Information Institute; Fortune