Download
1 / 1
10 likes | 104 Views
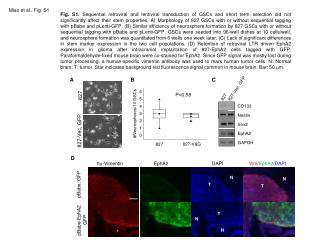
C. 80. 12.0. 60. % root growth. 40. 8.0. root growth in ethylene (mm). *. *. 20. 4.0. LRC. 0. Columella. 0.0. Col. Epidermis. J2812. axr3-1. Q2393. aux1-22. Cortex. Col. UAS:axr3-1. J2812. axr3-1. J2812>axr3-1. Q2393. Q2393>axr3-1. aux1-22. Endodermis. UAS:axr3-1.

E N D
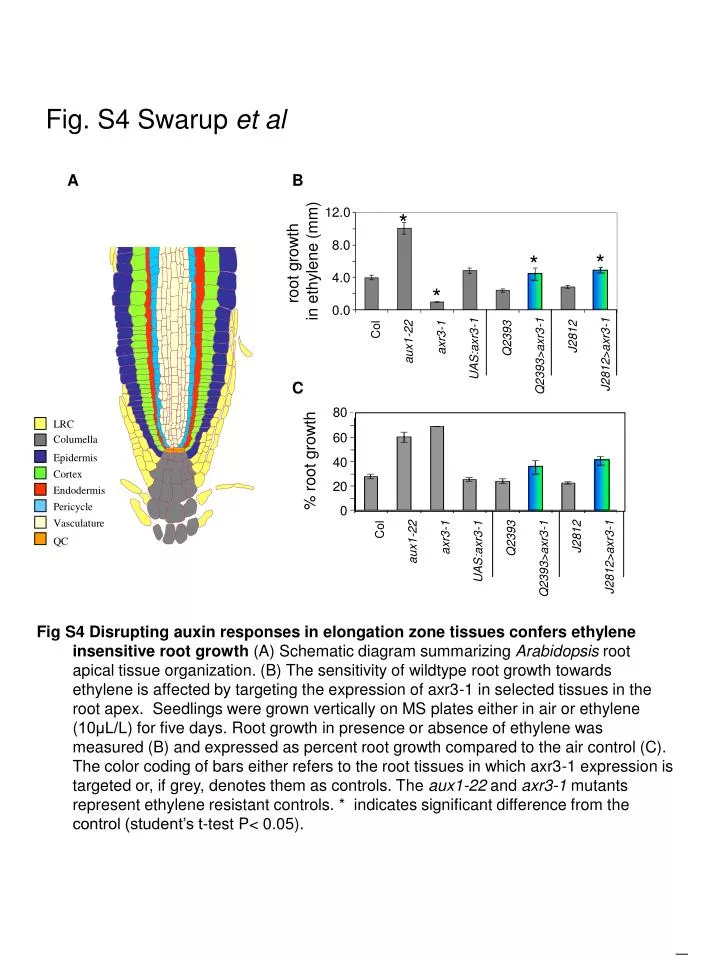
C 80 12.0 60 % root growth 40 8.0 root growth in ethylene (mm) * * 20 4.0 LRC 0 Columella 0.0 Col Epidermis J2812 axr3-1 Q2393 aux1-22 Cortex Col UAS:axr3-1 J2812 axr3-1 J2812>axr3-1 Q2393 Q2393>axr3-1 aux1-22 Endodermis UAS:axr3-1 J2812>axr3-1 Q2393>axr3-1 Pericycle Vasculature QC Fig. S4 Swarup et al A B * * Fig S4 Disrupting auxin responses in elongation zone tissues confers ethylene insensitive root growth (A) Schematic diagram summarizing Arabidopsis root apical tissue organization. (B) The sensitivity of wildtyperoot growth towards ethylene is affected by targeting the expression of axr3-1 in selected tissues in the root apex. Seedlings were grown vertically on MS plates either in air or ethylene (10μL/L) for five days. Root growth in presence or absence of ethylene was measured (B) and expressed as percent root growth compared to the air control (C). The color coding of bars either refers to the root tissues in which axr3-1 expression is targeted or, if grey, denotes them as controls. The aux1-22 and axr3-1 mutants represent ethylene resistant controls. * indicates significant difference from the control (student’s t-test P< 0.05). ein2