Download
1 / 40
400 likes | 548 Views
Front End Electronics for the ALICE TPC TPC SYMPOSIUM Berkeley, October 17, 2003. Luciano Musa – CERN Luciano.musa@cern.ch http://ep-ed-alice-tpc.web.cern.ch/ep-ed-alice-tpc/. TPC FEE Collaboration Bergen, CERN, Darmstadt TU Frankfurt, Heidelberg, Lund, Oslo. OUTLINE

E N D
Front End Electronics for the ALICE TPCTPC SYMPOSIUMBerkeley, October 17, 2003 Luciano Musa – CERN Luciano.musa@cern.ch http://ep-ed-alice-tpc.web.cern.ch/ep-ed-alice-tpc/ TPC FEE Collaboration Bergen, CERN, Darmstadt TU Frankfurt, Heidelberg, Lund, Oslo
OUTLINE How to measure in high track density environment? The pile-up (ion-tail) problem in MPW Signal conditioning (pre-processing) in the front-end components Architecture and main components Measured performance FEE for the ALICE TPC
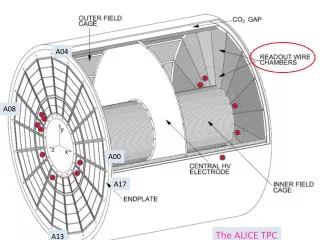
How to Measure in a High Track Density Environment? ALICE TPC LAYOUT GAS VOLUME 88 m3 DRIFT GAS 90% Ne - 10%CO2 E E 400 V / cm 88us 88ms • LARGE DATA VOLUME • 570 132 (pads) x 1000 (time bins) • 712 Mbytes / event • Pb – Pb (@200 Hz) 142 Gbyte / sec • p-p (@1KHz) 710 GByte /sec 510 cm ALICE TPC CHALLENGES up to 2x10⁴ charged particles in TPC
How to Measure in a High Track Density? TPC OCCUPANCY(*) IN THE PAD-TIME SPACE: • INNERMOST PAD ROW: 50% • OUTERMOST PAD ROW: 17% • AVERAGE OCCUPANCY: 25% (*)Occupancy = NABOVE / NALL Occupancy figure for an ideal cancellation of the ion tail! 40% occupancy! CLUSTER AT THE INNERMOST PAD ROW OF THE TPC
1 0 0 0 c l u s t e r p e a k s m o n t e c a r l o d a t a 9 0 0 8 0 0 Pad Row: 9 Nr samples after zero suppression: 310 Nr clusters: 76 Mean time between clusters: 1.2 ms 7 0 0 6 0 0 5 0 0 Physics of the Aliroot Monte Carlo 4 0 0 • Ionization in gas • Generation of secondary electrons • Diffusion of electrons • Electron attachment • E x B effect near the anode wires • Avalanche of the anode wire • Charge induced on pads and pad response function • Shaping and sampling time signal 3 0 0 2 0 0 1 0 0 0 0 1 0 0 2 0 0 3 0 0 4 0 0 5 0 0 6 0 0 7 0 0 How to Measure in a High Track Density? Aliroot: Montecarlo with microscopic TPC simulation
The Ion–Tail Problem Test of Inner Readout Chamber with final FEE in Field Cage prototype Ionization from 83Kr Decay Ion tail
1 0 0 0 c l u s t e r p e a k s m o n t e c a r l o d a t a 9 0 0 Aliroot data convoluted with measured signal 8 0 0 Pad Row: 9 Nr samples after zero suppression: 310 Nr clusters: 76 Mean time between clusters: 1.2 ms 7 0 0 6 0 0 5 0 0 4 0 0 3 0 0 2 0 0 1 0 0 0 0 1 0 0 2 0 0 3 0 0 4 0 0 5 0 0 6 0 0 7 0 0 The Ion–Tail Problem Aliroot: Montecarlo with microscopic TPC simulation
The Ion–Tail Problem Aliroot data convoluted with measured signal Signal corresponding to 1 MIP
Digital Conditioning of the TPC Signal Ion Tail Cancellation The measured TPC signal is approximated by the sum of exponential terms: and processed by a linear network that cancels all but the fastest terms: F(t): impulse response function of the network is(t): current induced on the pad • Can the algorithm be implemented with sufficient accuracy by an hardwired circuit? • Is the shape of the signal the same for all avalanches ? • NA49, NA45 and STAR: 1st order analog filter (two exponential terms) • ALICE: 3rd order digital filter (four exponential terms)
ADC counts ADC counts filter off filter off Signal corresponding to 1 MIP Signal corresponding to 1 MIP Time samples (170 ns) Time samples (170 ns) ADC counts ADC counts filter on filter on Time samples (170 ns) Time samples (170 ns) Digital Conditioning of the TPC Signal DIGITAL TAIL CANCELLATION PERFORMANCE
Baseline perturbations: • temp. variation (ramp-up) • gating grid switching • power supply instability • pick-up noise Digital Conditioning of the TPC Signal ALIROOT CLUSTERS + BASELINE PERTURBATIONS EVENT 2 ADC counts EVENT 1 EVENT 3 time samples
BC II BC I TCF Digital Conditioning of the TPC Signal EV 1 EV 2 EV 1 EV 2 EV 3 EV 3 ADC EV 1 EV 1 EV 2 EV 2 EV 3 EV 3
Architecture and Main Components Digital Circuit FEC (Front End Card) - 128 CHANNELS (CLOSE TO THE READOUT PLANE) DETECTOR Power consumption: < 40 mW / channel L1: 5ms 200 Hz 8 CHIPS x 16 CH / CHIP 8 CHIPS x 16 CH / CHIP drift region 88ms L2: < 100 ms 200 Hz ALTRO gating grid PASA ADC RAM anode wire DDL (3200 CH / DDL) CUSTOM IC (CMOS 0.35mm) pad plane 570132 PADS CUSTOM IC (CMOS 0.25mm ) • GAIN EQUALIZ. • LINEARIZATION • BASELINE CORR. • TAIL CANCELL. • ZERO SUPPR. CSA SEMI-GAUSS. SHAPER 1 MIP = 4.8 fC S/N = 30 : 1 DYNAMIC = 30 MIP 10 BIT < 10 MHz MULTI-EVENT MEMORY GAIN = 12 mV / fC FWHM = 190 ns FEE FOR THE NA49 AND STAR TPCs • analog memory in front of the ADC readout time independent of the occupancy • no zero suppression in the FEE high data throughput on the detector data links
Noise < 103 e < 1mV MIP = 3x10⁴ e 30mV Q Q/Cf PRE-AMPLIFIER SHAPING AMPLIFIER (PASA) Cf // Rf (RC)4 Q + CfRf OPA OPA OPA - CSA OA SHA MAIN CHARACTERISTICS PASA RESPONSE FUNCTION • Gain: 12mV / fC (@ 12pF) • FWHM: 190ns • Noise: 566e (@ 12pF) • INL: < 1% • Crosstalk: < 0.1% • Power: 11 mW / ch Q = 149 fC A(t / t)4e-4(t/t) FWHM = 190 ns
ALICE TPC READOUT CHIP (ALTRO) 10-bit arithmetic 10- bit 20 MSPS 11- bit CA2 arithmetic 18- bit CA2 arithmetic 11- bit arithmetic 40-bit format 40-bit format MAX SAMPLING CLOCK 40 MHz MAX READOUT CLOCK 60 MHz 16-CH Signal Digitizer and Processor • HCMOS7 0.25 mm (ST) • area: 64 mm2 • power: 16 mW / ch • ADC ENOB: 9.5 (@ 10MHz) • Data memory: 800 kbit • output bandwidth: 300MB/s
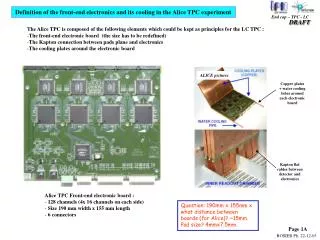
Front End Card: Layout, Cooling and Mounting current monitoring & supervision Shaping Amplifiers ALTROs COOLING PLATES (COPPER) voltage regulators power connector control bus connector WATER COOLING PIPE 190 mm readout bus connectors GTL transceivers (back side) INNER READOUT CHAMBER 155 mm
TESTS WITH ALICE TPC PROTOTYPE SYSTEM NOISE 0.9 ADC count = 1000 e
TESTS WITH ALICE TPC PROTOTYPE IONIZATION WITH COSMIC RAYS INPUT AFTER TCF+MAF 10 MIP 1 MIP Arrival of the ions to the Cathode wires
TESTS WITH ALICE TPC PROTOTYPE IONIZATION WITH COSMIC RAYS OCCUPANCY ~ 50% INPUT AFTER TCF+MAF
Summary and Conclusions • ALICE TPC FEE • New electronics for on detector digital signal conditioning and high readout rate • High resolution can be preserved, in presence of fast switching digital electronics, with proper time scheduling of digital processing and analogue to digital conversion • Tests show an accurate (~0.1%) ion-tail cancellation and baseline restoration when applied to the ALICE conditions • Perturbations of the baseline and gain dispersion are corrected with digital filtering techniques • Production of the main components is well advanced and on schedule for the detector commissioning in middle of 2004
HD2 HD3 HD4 ALICE TPC READOUT CHIP (ALTRO) Quartz Jitter: 25ps r.m.s. 0.5 LSB Amplitude Uncertainty: ALTRO: a 16-channel A/D converter and digital processor chip L. Musa et al. - ESSCIRC – June 2002 0.5 bits at 4.8 MHz BW at PASA output
PASA – ADC – DIG. Detector Link (100 MB / s) (#216) Global Architecture Each TPC Sector is served by 6 Readout Subsystems ON DETECTOR COUNTING ROOM Front-end bus (200 MB / sec) FEC 128 ch 25 RCU Data Compr. DDL - INT FEC 128 ch 2 BOARD CTRL Slow-Control Interface Local Controller FEC 128 ch Ethernet 1 TTC-RX Local Slow- Control Serial link Overall TPC: 4356 Front End Card 216 Readout Control Unit
FRONT VIEW 36 trapezoidal sectors C6 : 20 FECs Outer chamber C5 : 20 FECs C4 : 20 FECs FEC C3 : 18 FECs C2 : 25 FECs Inner chamber • FEE POWER: • CHANNEL: 40 mW • BOARD: 6.9 W C1 : 18 FECs • SECTOR: 832 W • TOTAL: 30.2 KW Connection to the pad plane MOUNTING SIDE VIEW 128 channels Front End Card (FEC) 190mm 140mm Capton Cable
4cards 16 ch ALTRO EVOLUTION 4 PQFP 100 8 SSOP 28 24 mm 135 mm 20 mm Integrated ADCs 1998 CHANNELS / CHIP: 1 POWER / CH: 120mW PRICE / CH: 50CHF 1999 CHANNELS / CHIP: 4 POWER / CH: 80mW PRICE / CH: 8CHF 2001 CHANNELS / CHIP: 1 POWER / CH: 16mW PRICE / CH: 5CHF
FRONT END CARD FIRST PROTOTYPE NEW DESIGN 300 mm 190 mm 240 mm 155 mm
Projection of a slice (2o in q) dNch / dy = 8000 Projection of the drift volume into the pad plane Nr Pixels 570132 pads x 500 time bins pad row Nr hits = 19431047 slice: 2o in q Nch(-0.5<<0.5) = 8000 How to Measure in a High Track Density? The ALICE Event Display ALICE CHALLENGE
Single avalanche FWHM = 200 ns How to Measure in a High Track Density? • Z (time direction): fewer time bins limitations: • signal/noise gets critical for FWHM < 200 ns • temporal signal is diffusion limited • oversampling • R-f (pad direction): smaller pads limitations: • # of channels (cost!) • HV-GND gets critial • PRF is diffusion limited • oversampling • Conclusion • choose the time/pad area which yields still reasonable signal (S/N > 20) • for a given pad area optimize aspect ratio • minimize diffusion: “cold gas”, use high drift field
Signal induced by a single electron-ion pair How to Measure in a High Track Density? TPC WORKING PRINCIPLE
Signal induced by a single electron-ion pair The Ion–Tail Problem AVALANCHE PROCESS • In the readout chamber multiplication starts at 400 mm from the anode wires • The electron induced current growth in 5-10 ps from 10% to 90% of its final value • Ions move slowly and need 30 -110ms to reach their destination • The ion induced current has a long tail with a rather complex shape Signal induced by a single avalanche
TESTS WITH ALICE TPC PROTOTYPE Results: Cosmic Run Alignment for Pulses in a single channel 0.1%
Data Processor • Correction of: • Slow drifts and systematic effects • Non-systematic effects • Tail filtering • Data compression • 40-bit back • linked format • Channel address • Time stamp Memory TSA1001 5 kbyte 4 or 8 buffers 10-bit 25 MSPS 40 MSPS Input Signal 0 L1: acquisition L2: event freeze Trigger signals 40-bit wide bus Bandwidth: 300 Mbyte/s Readout bus ALTRO Block Diagram
Systematic perturbation Baseline drift Fixed pedestal Slow drifts Systematic perturbation Combination fpd = 0 Baseline Correction 1
Tail Cancellation Filter Input Output 11 bit 11 bit L1 L2 L3 Z-1 Z-1 Z-1 K1 K2 K3 18 bit 10 9 0 din 2’s Complement 17 16 12 11 2 1 0 Fixed-Point Arithmetic Sign Overflow Base Range Decimals 2’s Complement 10 1 0 dout 2’s Complement
Filter Operation Filter Filter Compensates Undershoot Narrows the pulse Improves cluster separation when pile-up occurs Filter Gain equalization
Operation • din - bsl + offset , 0 dout 1023 • 0 , dout < 0 • din - bsl + offset - 1024 , dout > 1023 bsl calculation bsl frozen After Tail Cancellation Filter After Baseline Correction II A fixed threshold can now be applied safely Double threshold BC II • Unsigned 11-bit FIR system Baseline Correction 2 • Characteristics: • Corrects non-systematic perturbations during the processing time • Moving Average Filter (MAF) • Double threshold scheme (acceptance window) • 1. Slow variations of the signal Baseline updated • 2. Fast variations of the signal Baseline value frozen
Digital Conditioning of the TPC Signal A fixed threshold for Zero Supression is not a suitable solution The BC1 cannot correct non-systematic perturbations Filter does not remove the perturbation because it is not related to the tail Every sample within this window will be averaged and used to calculate next sample’s window A fixed threshold can now be applied safely Perturbation has been removed
Zero Suppression 11 Z-1 din Z-1 Z-1 Z-1 Z-1 Z-1 Z-1 Z-1 Z-1 Z-1 Z-1 Z-1 dout 10 a glitch filter pre-samples post-samples cluster merger ³ a ³ b flag b thr0 10 4 Z-1 4 Z-1 3 Z-1
Zero Suppression Operation above-threshold samples pre-samples post-samples fill-in samples rejected glitches dismissed samples discarded glitches adjoined pre and post samples merged clusters