Download
1 / 11
110 likes | 212 Views
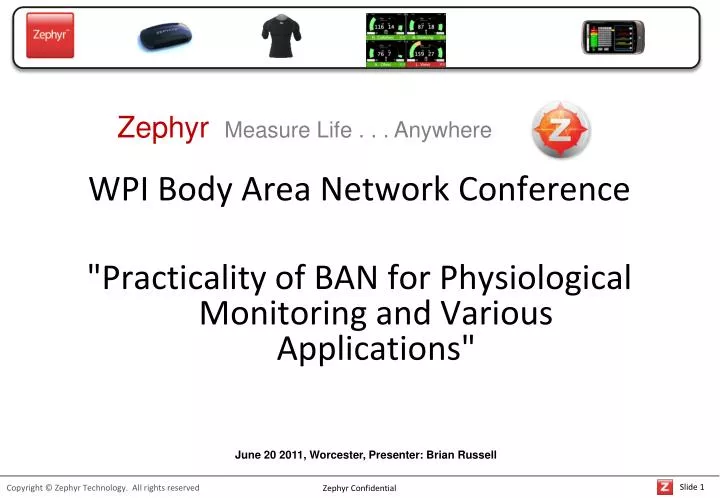
Zephyr Measure Life . . . Anywhere. WPI Body Area Network Conference " Practicality of BAN for Physiological Monitoring and Various Applications". June 20 2011, Worcester, Presenter: Brian Russell. BioHarness ™ - BlueTooth BAN. Biometric Monitors ECG, Heart rate, Breathing Rate,

E N D
ZephyrMeasure Life . . . Anywhere WPI Body Area Network Conference "Practicality of BAN for Physiological Monitoring and Various Applications" June 20 2011, Worcester, Presenter: Brian Russell
BioHarness™ - BlueTooth BAN • Biometric Monitors • ECG, Heart rate, • Breathing Rate, • Skin temperature, • Activity • Posture • Built in BioSense® analysis algorithms • Logging for 20 days • Local wireless (Bluetooth) • Wired (optical) - defense BioModule Prototype Blood Oxygen Blood Pressure Shirt BioHarness Radio interface device to voice radio Mobile feedback
BAN to Internet BAN connects system to the cloud Data is valuable when viewed some where else Connects to other Apps – e.g. DISPATCH Zephyr’s API will allow channel partners to Zephyr Vault The web portal securely stores all Published data from remote sensors. From here mobile phones and personal computers can access the information transmitted by the devices in real time Personal Data User transmitting personal bio-statistics through a Zephyr BioHarness Blood Glucose Radio Device Person uses radio/phone to connect to the cloud BioHarness Web Portal Performance is viewed and analyzed in the cloud. Blood Oxygen Weigh Scale Blood Pressure
BAN Tactical Communications MEDEVAC Soldier Squad Commander Medic FOB Field Hospital C2 = Command and Control TCCC = Tactical Combat Casualty Care Command and Control Tactical Net Group Medical Summary Sat / Tactical Radio or Cellular Satellite Cellular Tactical Radio UWB / Bluetooth HQ Local Commander 100 ft 2 to 10 miles over the horizon
3 3 1 1 2 2 8 4 9 5 5 6 7 7 8 4 6 BAN should support concept of operation Squad quick ropes from helicopter Sniper goes to high ground Attack group assembles behind ground cover Sniper is ambushed and injured. He uses his personnel PSM display to treat himself. Squad commander sees the injury on his device and changes tactics assuming no over site from fire control. Medic uses his PSM display determines Sniper is dealing with bleeding and is not in shock so stays with attack team. Attack team splits and enters building. Attack team has casualty, medic sees this on his display and attends casualty. Medic takes casualty to CCP, casualty collection point. COC, command and control at FOB, Forward Op Base, sees causalities on their display and immediately deploys QRF, Quick Reaction Force. MEDEVAC sees vitals on their PSM display, gives advice and treats immediately. ! ! +
PSM use examples in First Responder • ON SCENE • UPDSIDE DOWN = BAD always • STATIONARY = BAD for a Fire Fighter • HEART RATE RECOVERY= indicates fatigue, uses combination of HR and Acceleration. • REHAB • Automate vital sign monitoring. HRrest, BRrest, BP, SpO2 • Reduce EMS workload, trending offers more insight than occasional data. • FITNESS • Increased fitness = less risk of heart attack and increased situational awareness. Europe has a VO2max > 45 ml/min/kg • TRAINING • Remote vital signs to monitor performance for job related training. • Normal levels indicates safety and continuation is acceptable.
New Technology – value analysis PERSONAL PERFORMANCE ORGANISATION WORK FLOW FASHION COMFORT Only unnoticeable tech Will be adopted. No one wants to look silly. RADIO RANGE Under all realistic obstacles and interferes DEPLOYMENT At base, going to on scene, during the mission, maintenance SITUATIONAL AWARENESS Allows prediction future mission success. Increased safety. Personal and to commanders 10 12 11 1 2 7 3 8 9 5 4 6 BATTERY LIFE Operational ease of use. Multi mission capability. Minimum spares. Easily purchased in the field. Battery life time vs cycles. ENTANGLEMENT RISK Tech should not encumber or snag. TRAINING LOAD Easy to use and remember how to use. Applies to wearer and the support /command team. Uses standard measures COST SAVINGS Can be from increased mission efficiency, decreased injuries or less overall equipment SIZE WEIGHT Always a minimum. Extra weight removes Other equipment or Increases fatigue. STANDARDS Susceptibility to jamming, Detectability by others, Environmental loads NFPA, FCC, Intrinsic safety, CE, FDA, HIPAA … EQUIPMENT INTEGRATION Radio, computers, displays, computers, uniform DONNING DOFFING Ease of use is imperative
Value Analysis Examples COLD: Custom short range ISM radio good for situational awareness, interference issues, not enough range for operational use, not a standard interface to other systems. WARM: Bluetooth connected shirts to APCO Radios good for situational awareness, integrated into uniform, Bluetooth good for displays, requires Motorola radios HOT: Cellular connected shirts Secure cellular in uniform. Zero deployment hassle and always connected to internet. Still needs BAN for displays
Tracking and Managing Player Fatigue This plot shows Heart Rate Percentage and Heart Rate Recovery trends over time through an entire hockey game. The downward trend in Heart Rate Recovery correlates to the fatigue of the player resulting in a decrease in sharpness and performance as well as a decrease in aggressiveness of play. HRR can be tracked in live mode based on our algorithms which automatically detect and display the data in the player’s bioguage. Knowing what level is too low for a player is key to knowing how ready they are to perform at their optimal level of performance.
Tracking/Detecting Impact on Players Continuous measurement of impact, track how much abuse players are enduring game to game. This image shows a 14g impact when one player was slammed into the boards.