Download
1 / 21
210 likes | 455 Views
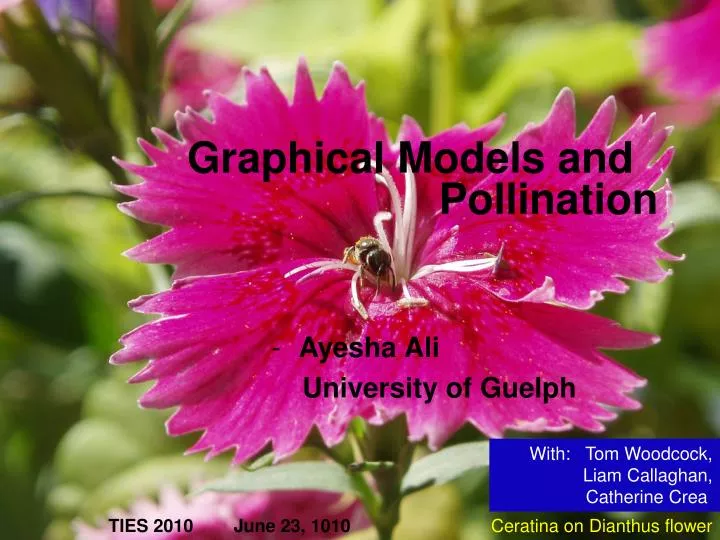
Graphical Models and Pollination. Ayesha Ali University of Guelph. With: Tom Woodcock, Liam Callaghan, Catherine Crea. TIES 2010 June 23, 1010. Ceratina on Dianthus flower. Outline. Motivation: Pollination Ecology Qualitative Pollination Webs

E N D
Graphical Models and Pollination • Ayesha Ali • University of Guelph With: Tom Woodcock, Liam Callaghan, Catherine Crea. TIES 2010 June 23, 1010 Ceratina on Dianthus flower
Outline • Motivation: Pollination Ecology • Qualitative Pollination Webs - Feature Extraction • Quantitative Pollination Webs - Driving Mechanisms • Hierarchical graphical models
Motivation: Mutualistic relationship • Plants need to be pollinated by birds and insects for reproduction • Offer rewards for being visited, (e.g. pollen, nectar, oil) Halictidae on Queen Anne’s Lace
Motivation: Species decline • Recent years has seen a decline in some insect species (e.g. bees) • Forest fragmentation has led to a decline in some plant species Andrena – native wild bee
Motivation: Species decline • Extinction of given plant may adversely affect survival of given insect, and vice versa (e.g. Mauna Kea silversword ) • Need to maintain species abundance / diversity in ecosystem • Ans: Pollination webs? Orthonevra drinking nectar on HopTree
Pollination Webs: bi-partite graph • Nodes are plant and insect species • Edges from insects to plants represent plant-insect interaction • Often called “interaction” or “visitation” web • Only small fraction of interactions observed • Similar to food webs, except role of pollinator and pollinated never change
Pollination Webs: bi-partite graph Pollinators (Insects) Pollinated (Plants)
Pollination ecologist approach • Use adjacency matrix I (N x M) I AF = 1 if animal A visited flower F 0 otherwise • Given a pollination web, what are the important features that characterize the plant-pollinator interactions?
Pollination Webs Pollinators (Insects) Pollinated (Plants)
Ecosystem Interventions • Can we infer consequence of eco-system disturbances (eg. removal of a player due to forest fragmentation)? • Which plants or animals are vulnerable to presence of non-natives? • Problem: • Quantification of connection strength, and • Understanding mechanism behind interactions
Quantified Pollination Webs • Let Xij = frequency of ij-interactions observed • Conditional on the total number of counts, X ~ Multinomial(p) • Proportions are correlated within insect species • Observed interactions are actually a mixture of pollination visits, and non-pollination visits
Quantified Pollination Webs • We can use graphical models to represent the data generating mechanism • Two main issues: How to incorporate • Visit type • Driving force behind interactions? • Use hierarchical graphical model, with probability that an insect-plant pair interact depending on other variables
Hierarchical Pollination Model I • Insects visit one of M floral species, with probability based on the unobserved visit type • Use a variational EM-algorithm to get a generative model of the process, by incorporating the unobserved visit types • Similar idea in AI user rating profile models: • Users rate each of M items, based on some unobserved attitude toward each item
Hierarchical Pollination Model I α p • For each specie: • X | z,p ~ Multin(pz) • Z | θ ~ Bern(θ) • θ ~ Beta() θ X Z M na • Z is an unobserved random variable that is 1 if pollination visit, 0 otherwise • pafz = Pr(insect a visits plant f | visit type z)
Hierarchical Pollination Model I • Free energy maximization (Neal and Hinton) • E-step: compute • M-step: maximize free energy wrt variational and model parameters (fixed-point iteration or Newton-Raphson)
Hierarchical Pollination Model II • Borrow from econometrics choice models: • Consumers assign a utility to each of M items • Conditional on the total number of counts, X ~ Multinomial(p)
Hierarchical Pollination Model II δ β • For each specie a: • X | p ~ Multin(p) • exp(ηjg)| δa ~ • Gamma(δa-1λfa, δa-1) • p ~ Dirichlet(δa-1λa) η p X M w na • p follows a Dirichlet-multinomial regression: • Space, time, phenotypic and/or phylogenetic traits of pollinators or flowers or both
Hierarchical Pollination Model II • Fitting presents no computational issues – Newton-Raphson can converge quickly • Can use existing software to fit model (LIMDEP, Stata, etc.: negative binomial with fixed effects for panel count data) • Vasquez et al. (2009) present a non-stochastic version of this framework
Conclusions • Pollination webs can help to understand insect-floral interactions • Hierarchical models provide a framework for incorporating covariates into the generative model • Provide insights into where conservation efforts should be placed
Future Works • Learn linkage rules: mine bootstrapped samples of data • Overdispersion due to “real” zero-interactions • Modify error distribution for utilities in order to study competition between insects
THANKS! • CANPOLIN • Tom Woodcock • Elizabeth Elle • Peter Kevan Syrphidae Pt Pelee