1 / 9

Global Circulation Model Predictions of Future Temperatures

Global Circulation Model Predictions of Future Temperatures. Maps compiled from the IPCC DDC web tool that allows access to GCM modeling results NASA’s GISS ER model used for all simulations

wilfred
Download Presentation

Global Circulation Model Predictions of Future Temperatures

An Image/Link below is provided (as is) to download presentation Download Policy: Content on the Website is provided to you AS IS for your information and personal use and may not be sold / licensed / shared on other websites without getting consent from its author. Content is provided to you AS IS for your information and personal use only. Download presentation by click this link. While downloading, if for some reason you are not able to download a presentation, the publisher may have deleted the file from their server. During download, if you can't get a presentation, the file might be deleted by the publisher.

E N D

Presentation Transcript


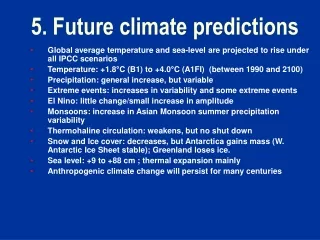
  1. Global Circulation Model Predictions of Future Temperatures • Maps compiled from the IPCC DDC web tool that allows access to GCM modeling results • NASA’s GISS ER model used for all simulations • Temperature anomalies presented as difference between late 21st century temperatures (2080-2099 average) and the 1961-1990 30-year average baseline. • IPCC SRES Scenarios presented as: • Worst case (A2) • Moderate case (A1B) • Best case (B1) • Note – other scenarios can be found that give worse “worst” case and better “best” case predictions, but the ones chosen here are commonly used

  2. January 2080-2099

  3. Best Case – January 2080-2099

  4. Moderate Case – January 2080-2099

  5. Worst Case – January 2080-2099

  6. July 2080-2099

  7. Best Case – July 2080-2099

  8. Moderate Case – July 2080-2099

  9. Worst Case – July 2080-2099

More Related