Download
1 / 11
110 likes | 211 Views
Exhibit A. 7 May Dredge Plan Analysis. The costs are too high . The Special Service District (SSD) = 51.5 cents Is a self-imposed property tax increase of 55% for 16 years Increases our taxes from 93 to 144.5 cents—highest in the city

E N D
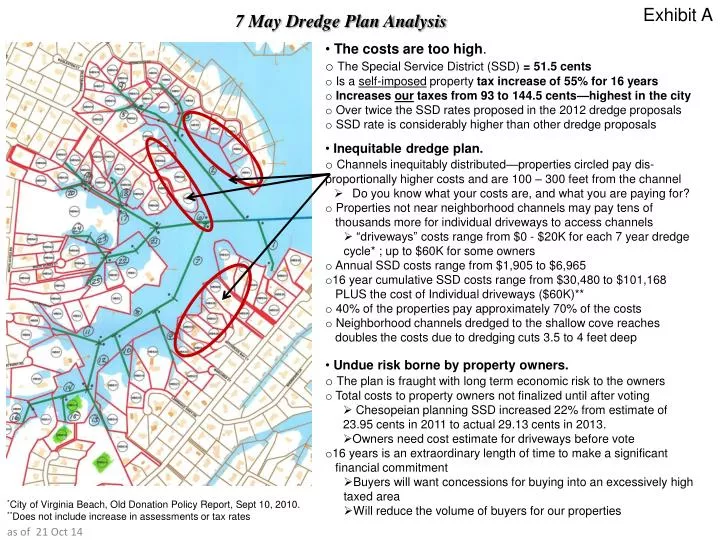
Exhibit A 7 May Dredge Plan Analysis • The costs are too high. • The Special Service District (SSD) = 51.5 cents • Is a self-imposed property tax increase of 55% for 16 years • Increases our taxes from 93 to 144.5 cents—highest in the city • Over twice the SSD rates proposed in the 2012 dredge proposals • SSD rate is considerably higher than other dredge proposals • Inequitable dredge plan. • Channels inequitably distributed—properties circled pay dis-proportionally higher costs and are 100 – 300 feet from the channel • Do you know what your costs are, and what you are paying for? • Properties not near neighborhood channels may pay tens of • thousands more for individual driveways to access channels • “driveways”costsrange from $0 - $20K for each 7 year dredge cycle* ; up to $60K for some owners • Annual SSD costs range from $1,905 to $6,965 • 16 year cumulative SSD costs range from $30,480 to $101,168 • PLUS the cost of Individual driveways ($60K)** • 40% of the properties pay approximately 70% of the costs • Neighborhood channels dredged to the shallow cove reaches • doubles the costs due to dredging cuts 3.5 to 4 feet deep • Undue risk borne by property owners. • The plan is fraught with long term economic risk to the owners • Total costs to property owners not finalized until after voting • Chesopeian planning SSD increased 22% from estimate of 23.95 cents in 2011 to actual 29.13 cents in 2013. • Owners need cost estimate for driveways before vote • 16 years is an extraordinary length of time to make a significant • financial commitment • Buyers will want concessions for buying into an excessively high taxed area • Will reduce the volume of buyers for our properties *City of Virginia Beach, Old Donation Policy Report, Sept 10, 2010. **Does not include increase in assessments or tax rates
7 May, Witchduck Individual Channel Costs* Exhibit B Calculations based on data provided from the City’s April ’14 Dredge analysis. While some of the values in the data fields are outdated (i.e., new construction), generally we believe the data is statistically sufficient to conduct a representative analysis. All information is available upon request.
Exhibit C OPTION A, Affordable and Equitable (pay for your portions of the dredging) Neighborhood channels include: 2, 7, 8, 11,12,17,21,22 = $2,301,611/16 years= $143,851 per year 143,851 / 6,147.09 = SSD 23.40 (this cost is very close to the 2014 Thoroughgoodcove estimate (which was defeated) and near the 2102 Witchduck and Thoroughgood SSD estimates (defeated as well). Further cost savings will be gained by reducing Channel 2 length by up to 500 feet. As drawn on the 7 May plan it approaches several properties offering them a greater benefit than others. Additional cost reductions could be saved by narrowing the width of Some of these channels to 12 – 8 feet, vice 20 – 15 feet. Rationale for channels selected: above channels traverse most of the wider bodies of the coves and for the most part do not cross property lines or approach docks/yards within a few hundred feet. Channel 6 should be funded by the city. For other dredge projects the city has funded up to over 20% of the cost. For the 7 May plan, the city only funds 5.5%. Extending the city’s spur to include channel 6 will bring the city’s share to about 10%. This option significantly reduces the shared costs of the SSD, shifts the burden to the property owners to pay for their portions of what they want dredged, and does not unfairly dredge close to some properties at the expense of others. Neighbor property owners could band together to fund and design neighbor driveways to their own specifications and needs, i.e., widths, depths, lengths. This would not burden other owners and makes more equitable. Extend city spur to include channel 6 = Omit channel from dredge plan funded by SSD
Exhibit D OPTION B, The Equitable, costly plan (everyone gets near access to channels) • Everyone gets a channel so that no property owners are exploited and everyone minimizes their costs of a driveway. • This entails adding up to 9 additional channels ranging from distances of 100 – 300 feet. See green dotted lines 1 – 9. • This option corrects the unfairness of the 7 May plan on determining which properties get channels or not. • The additional costs would be similar to channels 5,20, 23, 24 -- all costing approximately $30K for each dredging. Note: these values are higher than the $20K stated by the city in the • Old Donation Policy letter, which calls into the question that estimate’s accuracy. This is why owners need to be provided an estimate of any driveways prior to voting to make an informed decision. • This would increase the cost to: • $30K x 9 channels x 3 dredgings = $810,000 • $810,000 + $5,068,357 = $5,878,357 / 16 years = $367,397 • 367,397 / 6,147.09 = 59.76 cents SSD • Compared to individual SSD for coves 2 (73.34) and 3 (56.29) this cost does not seem that unreasonable. • For property owners that would have to pay for their own driveways, this cost is probably more affordable than having to pay the SSD and the additional driveway costs of $60K. • Many cost saving measures could be incorporated into this option and the others as well to lower the SSD: • City spur includes channel 6 • widths of smaller channels reduced to 8 – 10 ft • depths of some channels reduced by 1 foot • some owners say they don’t want a channel and are willing to forego deep water access to their property, but are still part of the SSD 3 2 1 4 Extend city spur to include channel 6 5 6 7 8 9 = additional channels added #
Exhibit E OPTION C, Each Cove separately (The right to determine your own neighborhood plan) Each cove’s neighbors determines their needs and requirements for designing the specifications for their cove and they fund with a combination of SSD and driveways The city spur includes channel 6 Each cove decides widths, depths and lengths of channels No cove imposes or exploits another cove The costs accurately reflect the costs incurred by each community and the burden is on the cove neighbors’ Ultimately, the costs are borne by each neighbor to pay their costs. This options takes into account each property owners decision to buy and live where they chose to live. The cost of altering the geography and ecology is borne by that cove’s neighbors Extend city spur to include channel 6
Cove 1 Analysis Exhibit F Channel costs 2 $682,358 3 211,959 4 162,771 5 96,482 Total $1,153,570 $1,153,570/16 years = $72,098 annual cost Average property value: $640,028 Property range: $261,900 – $1,140,800 Total assessment 25 properties = $16,000,700 $16,000,700/100 = 160,007 x .01 = $1600.07 $72,098 / 1,600.07 = 45.06 cents SSD For channel 2 only, SSD = 26.6 cents • Cove 1 channel SSD costs less than the total project. Observations: • Channels 3,4,5 are very close to all the properties they service at the back of the cove –significantly reducing any need for • “driveways” and out of pocket expenses separate from the SSD. Why do the properties at the back of the coves (which require • most of the dredging) get neighborhood channels to within tens of feet to their properties? • Stanfield properties account for much of the dredge volume (3.5 -4.0 feet deep) and pay proportionally less of the costs • Properties located parallel (dashed red ovals) to channel 2 pay disproportionally higher costs due to higher property values • In addition to the SSD, most will have to pay for their driveways of 100 - 300 feet to access the channel, which • could cost up to $20K each dredge cycle ($60K). These properties do not get the same benefit as the others. • Two properties are undeveloped;16/25 (64%) of the properties are significantly less than the project average. • The city’s only designated engineer for the dredging plans owns property here; engineering costs account for 20% of costs. • North side homes on Hermitage Pt pay no SSD; most buyers will want concessions for paying the highest taxes in the city. • Conclusion: The property owners in yellow endure significantly higher burden of the dredging SSD costs without the benefit of near access to the main channel (2). Additionally, they must pay tens of thousands more (dollars) for their own driveways to legitimately state they have deep water access, as their neighbors do –ironically at their expense. To make fair and equitable, dredging only channel 2 would reduce the SSD to 26.6 cents and shift the burden to properties to pay for their share of the project. *three dredgings; City of Virginia Beach, Old Donation Policy Report, Sept 10, 2010
Exhibit G Cove 2 Analysis Channel costs 1/3 of 6[1] $100,710 17 301,616 18 148,616 19 168,791 20 114,531 Total $843,264 $843,264/16 = $52,704 annual cost Average property value: $598,816 (excludes 2 tax relief properties) Property assessment Range $422,600 –$714,600 Total assessment 12 properties (2 tax relief properties excluded) = $7,185,800 $7,185,800 / 100 = 71,858 x .01 = 718.58 $52,704 / 718.58 = 73.34 cents SSD • Cove 2 SSD costs the most of all the coves and drives up the total costs for the whole project. Observations: • requires dredging up to 3.5 - 4 feet deep for channels. • channels are within tens of feet to properties/piers, significantly reducing need for driveways. • 2 properties are tax relief – they do not pay the SSD and costs are absorbed by all other property owners. • The property assessments are significantly below the project average of $749,648. • Conclusion: The only affordable way cove 2 can dredge is by getting all the coves involved and • shift the burden of its costs to the other property owners. Cove 2 properties pay the least and • receive the most benefit as they get neighborhood channels funded by the SSD, instead of • driveways funded by owners. [1] Coves 2, 3, 4 all need channel 6, so divided equally.
Exhibit H Cove 3 Analysis Channel costs 1/3 of 6 $100,710 21 117,596 22 122,670 23 105,917 24 90,466 25 131,123 Total $668,482 $668,482 / 16 = $41,780 annual cost Average property value: $686,93 Assessment range $279,600 – 1,114,800 Total assessment 11 properties $7,556,300 $7,556,300 / 100 = 75,563 x .01= 755.633 $41,780 / 755.63 = 55.29 cents SSD • Cove 3 costs approximates the project in total: Observations: • The assessment of the properties are below the project average of $749,648 • Two undeveloped properties owned by the project leader get channels close to those properties at a cost • of $255K paid for by the SSD. • Undeveloped properties pay the least of all property owners, shifting burden to the other property owners • Requires dredging 3.0 - 4 feet deep for channels • Channels are within tens of feet to properties, significantly reducing need for individually funded driveways • Conclusion: The biggest incentive for cove 3 properties is that the neighborhood channels are funded • by everyone in the SSD, which reduces their costs for any driveways. The owners of undeveloped properties have the highest potential to recoup SSD costs and stand to profit at others expense.
Cove 4 Analysis Exhibit I Channel costs 1/3 of 6 $100,710 1 163,834 7 280,725 8 378,391 9 253,949 10 144,489 11 229,178 12 189,077 13 171,504 14 266,336 Total $2,178,193 $2,178,193 / 16 = $ 136,137 annual cost Average property value $882,662; Assessment range $265,200 – $1,361,100 Total assessments 34 properties = $30,010,500 (excludes 1 tax relief property) $30,010,500 / 100 = 300,105 x .01 = 3,001.05 136,137 / 3,001.05 = 45.36 SSD cents • Cove 4 SSD costs are less than the other coves, but could be much lower if not for the channels and excluded properties • Average property values significantly higher than the project average; hence bear the burden of the costs. • The number of channels and their total costs are the most expensive. • Many properties on N. Witchduck Rd will have to pay for their own driveways to access the main channel – 7. • Properties serviced by SSD funded channels 1, 9,10,13, 14 minimize their driveway costs. • Four (4) properties valued at $2.3M removed from the dredge plan because they were “no” votes and could prevent • attaining 80%. City public works and cove captain states reason was because these properties were too far from • the channel and would not get service. If so, then many properties on coves 1 and 4 meet this exclusion. • This is a double standard and is gerrymandering. Deleting those 4 homes increases cove SSD by 3.44 cents. • Conclusion: Property owners facing channels 6 and 7 (red oblong circle) do not receive the same level of • service as those near channels 1, 9, 10, 13, 14. What is the rationale and how is this fair? These • properties will have to pay the SSD rate and for driveways to truly have deep water access. Omitting • the 4 properties to gerrymander the numbers raises the SSD costs for all.
Exhibit J SSD effects on Witchduck / Thoroughgood Properties Sum is estimated true cost over 16 years, not counting Increases to assessments and/or tax rates * City of Va Bch Properties: http://cvb.manatron.com/Tabs/PropertySearch.aspx ** The Virginian Pilot, Property Values rise in Virginia Beach, April 13, 2014 *** 7 May Preliminary Plan depicts numerous “Neighborhood channels” that did not appear in 2012 plans City of Virginia Beach, Old Donation Policy Report, Sept 10, 2010, driveways range from $5K – 20K
Exhibit K SSD Comparison* • http://www.vbgov.com/government/departments/public-works/coastal/pages/neighborhood-channel-dredging.aspx • ** Final SSD increased by 22% from original estimate