Download
1 / 10
110 likes | 340 Views
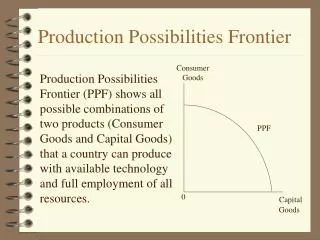
Production Possibilities Frontier. 1 st Economic Graph. Production Possibilities Frontier. Illustrates the full potential output of an economy and the tradeoff between producing 2 goods (opportunity cost)

E N D
Production Possibilities Frontier 1st Economic Graph
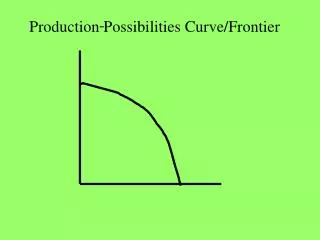
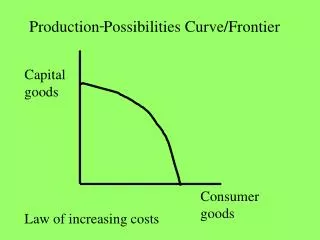
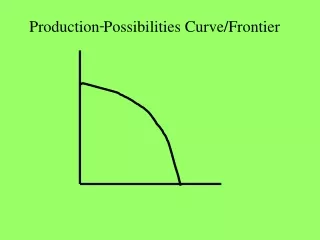
Production Possibilities Frontier • Illustrates the full potential output of an economy and the tradeoff between producing 2 goods (opportunity cost) • Assumptions:a country uses all resources (factors of production) to produce only 2 goods. Bowed Line: Increasing cost PPF Straight Line: Constant cost PPF
Any point above line is Unobtainable in Short Run with existing technology & resources (0,100) (50,50) Any point on line is Efficient production of goods i.e. @ full potential @ full employment (5.0% for USA) (100, 0) Any point below line is Inefficient i.e. Below full potential, wasting resources Constant Cost PPF Graph Qty Food . C . B . A Qty Shelter
Which Society is more EFFICIENT? Assumptions:-produce only 2 goods -same resources for both countries Country A Country B
Straight Line PPF • Slope = Opportunity Cost . A Qty Food What is the Opportunity Cost of moving from point A → B ? 10 . B 5 ---------- ----------- 10 5 Qty Shelter
B C Increasing Opportunity Cost! 800 “Bowed” PPF Curve Quantity Houses .A Opp. cost of moving from Point A B Opportunity Cost of gaining 400 Cars is 100 Houses Gain 1 Car Give up 1/4 House 1,000 Move from Point B C Opportunity Cost of gaining 400 Cars is 200 Houses Gain 1 Car Give up 1/2 House -------------- 900 700 ------------------------------- Quantity 400 0 1,000 Cars
4,000 3,000 G 2,300 2,200 A You get more from same scarce resources! 600 650 1,000 Economic Goal: Shift PPF outward Qty of Computers Increased Efficiency (productivity) will shift PPF curve outward Qty of 0 Cars
PPF Summary • PPF Line represents all efficient production points • Points below PPF are inefficient(not using resources fully) • Points above PPF are not attainable in short run • Cannot attain it with existing technology & resources • “Bowed” PPF curves have increasingopportunity cost • Straight Line PPF curves have constant opportunity cost • Long Run goal is to shift the line outward (become more efficient)
. .