Download
1 / 9
90 likes | 115 Views
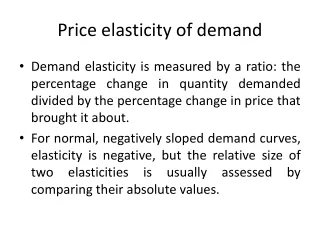
This chapter explores the concept of price elasticity of demand and its impact on quantity demanded in response to price changes. Learn about different types of demand curves, determinants of elasticity, and examples illustrating elasticity calculations.

E N D
AP Microeconomics Price Elasticity of Demand Chapter 5
D1 D1 D1 Slope of Demand Curves • All demand curves do not have the same slope • Slope indicates responsiveness of buyers to a change in price Which demand curve is most sensitive to price changes? Price Price Price Qty Qty Qty
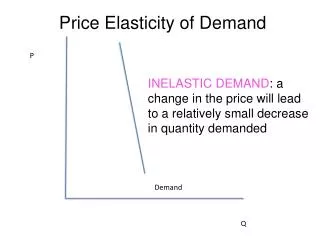
ELASTICITY OF DEMAND P ↑ => Qty D↓ P ↓ => Qty D↑ Px • Elasticity of demand (Ed) measures the sensitivity of quantity demanded in response to a change in price: Ed = % ∆ Qty D % ∆ P Qty Examples: Price ↑ 10% causes Qty Demanded ↓15% then Ed= ______ Price ↑ 10% causes Qty Demanded ↓5% then Ed= ______
3 Types of Demand Curves Price Price Inelastic = Steep Elastic = Flat • Elastic Demand = Ed is > 1 • % Qty D changes more than % price change • Inelastic Demand = Ed < 1 • % Qty D changes less than % price change • Unit Elastic Demand = Ed = 1 • % Qty D changes the same as % price change • Price ↓10% => Quantity Demanded ↑10% D1 D1 Qty Qty Ed = % ∆ Qty D % ∆ P
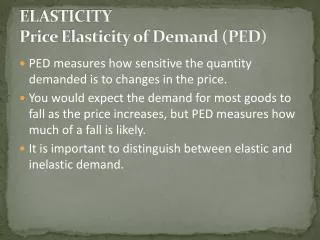
D1 D1 Determinants of Elasticity of Demand • Number of Close Substitutes (what else can you buy) • Necessities vs. Luxuries (do you have to buy it?) • Proportion of Income (is it expensive) • Time Horizon (when do you need it?) Demand is moreelastic when: • Larger # of substitutes • Good is a luxury • Larger proportion income • Longer time period Elastic Inelastic
Gasoline Soda Heart Surgery Table Salt Price Elastic orPrice Inelastic? Price Inelastic Necessity & No real substitutes Price Elastic Many substitutes Price Inelastic Necessity & No real substitutes, Short time period Price Inelastic Small proportion of income, no good substitute
Worksheet #1 • Lesson 4, Activity 18
2018?Can the U.S. reach Full Potential GDP? • SP500 Total Return • 2008 -37.0% • 2009 +26.0% • 2010 +15.0% • 2011 +0.0 % • 2012 +13.0% • +29.6% • +13.6% • -0.73% • +12.54% • +14.00% Dec 2007 – Dec 2015 +4.0% per year Dec 2008 - Dec 2015 +12.8% per year => $100,000 turns into $190,000