Download
1 / 56
560 likes | 739 Views
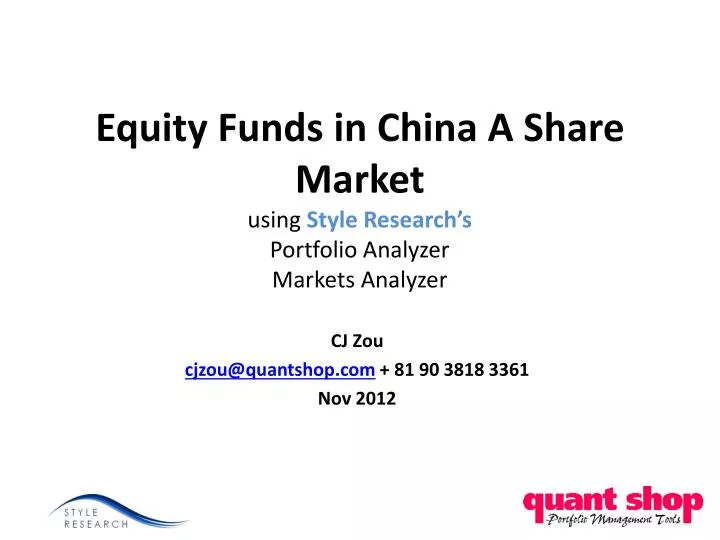
Equity Funds in China A Share Market using Style Research’s Portfolio Analyzer Markets Analyzer. CJ Zou cjzou@quantshop.com + 81 90 3818 3361 Nov 2012. Data and Approach. Data 393 China A shares equity funds (equity stocks>70%) end Jun 2012

E N D
Equity Funds in China A Share Marketusing Style Research’s Portfolio AnalyzerMarkets Analyzer CJ Zou cjzou@quantshop.com+ 81 90 3818 3361 Nov 2012
Data and Approach • Data • 393 China A shares equity funds (equity stocks>70%) end Jun 2012 • Performance Attribution is semiannual holdings data from June 2005 to Jun 2012. • Approach • Using Style Research Portfolio Analyzer: portfolios against Benchmark =CSI 300 • Using Style Research Markets Analyzer: market cap weighted, minimum stock size USD 100 million, sector adjusted, 6-month rebalance • Add cash in Chinese RMB if the portfolio does not sum to 100%. • Return: 12 months and 2 years excess return
5% of outliers excluded 95th Percentile 75th Percentile 50th Percentile (Median) 25th Percentile 5th Percentile
What are we going to cover? Where is the money? What are the risks? Where are risks from? What are the returns? Where are the returns from? What do the factor and Sector returns look like? Case study
Where are the risks? 50th Percentile (Median)
What are the returns? Where are the returns from? What do the factor and sector returns look like?
What are the returns? Distribution of Excess Returnslast 12 months 50th Percentile (Median)
Decomposition of the sources of return by Style Research • HIERARCHICAL METHODOLOGY decomposes returns into • Currency Component • Market Component • Sector Component • Style Component • Stock Component
Risks vs. Returns : Last 1 year Last 12 months Risks Last 12 months Returns
Excess Returns Decomposition Last 1 year vs. Last 2 years return Last 1 year Return Last 2 years Return
Looking at things differentlyInformation ratio top quartile(75% - 100%)
Looking at things differentlyInformation ratio bottom quartile(0% - 25%)
Conclusion • Where is the money • Style: Overweight growth and underweight value; Overweight momentum both in ST and MT, slightly large cap • Sector: Overweight Health care, Cons Staples, Cons Disc; underweight Energy and Telecom • Risks: Stock risk> Sector risk> style Risk • Returns • outperformed CSI 300 • managers made money from stock selection • Lost money from Sector – underweighted Telco, Finance, overweight Cons Disc • Lost money from Style – underweighted Value, overweight momentum • Info ratios: Stock > Sector and Style
Case Study the fund has highestinfo ratio
ABC fund – the Style Skyline High Beta high momentum
ABC fund– Style Distribution Invest in value and small growth stocks
ABC fund – Market Cap Invest in Small cap
ABC fund – Sector underweight financials, overweight industrials, active shares in financials
ABC fund – Risk Risk Attribution Equity risk!
ABC fund – Risk Contribution to Tracking Variance by Style
ABC fund – Risk Contribution to Tracking Variance by Sector
ABC fund – Return Contributions by Sector last 12 months - Biggest contributor to last 12 M returns is Industrials
ABC fund – Return Contributions by Style last 12 months - Biggest contributor to last 12 m return is Large value
Top 10&Bottom 10 Tracking Errors Top 10 Average 9.98 Bottom 10
Top 10 & Bottom TEs from sector Top 10 Average 35.5% Bottom 10
Top 10 & Bottom TEs from style Top 10 Average 10.7% Bottom 10
Top 10 & Bottom TEs from stock Top 10 Average 45% Bottom 10