Download
1 / 59
810 likes | 2.21k Views
Highway Capacity Software. Based on the Highway Capacity Manual (HCM) Special Report 209 Transportation Research Board (TRB), National Research Council (NRC). Ten Modules. Freeways Weaving Ramps Multi-lane Highways Two-lane Highways Signalized Intersections Unsignalized Intersections

E N D
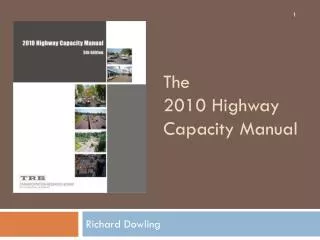
Highway Capacity Software • Based on the Highway Capacity Manual (HCM) • Special Report 209 • Transportation Research Board (TRB), National Research Council (NRC)
Ten Modules • Freeways • Weaving • Ramps • Multi-lane Highways • Two-lane Highways • Signalized Intersections • Unsignalized Intersections • Arterials • Transit • Pedestrians
Modules Included in CE 4640 • Signalized Intersections • Unsignalized Intersections • Multi-lane Highways • Two-lane Highways
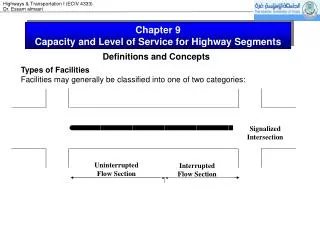
Signalized Intersections • Capacity • Defined for each lane group • Lane group: one or more lanes that accommodate traffic and have a common stopline • Lane group capacity: maximum rate of flow for the subject lane group that may pass through the intersection under prevailing traffic, roadway and signalized conditions
Traffic Conditions • Approach volumes (left, through, right) • Vehicle type • Location of bus stops • Pedestrian crossing flows • Parking movement
Roadway Conditions • Number and width of lanes • Grades • Lane use • Including parking lanes • Signalized Conditions • Signal phasing • Signal timing • Type of control • Signal progression
Level of Service (LOS) • Defined in terms of delay as a measure of • driver discomfort • Driver frustration • Fuel consumption • Lost travel time
Signalized Intersections • Delay experienced by a motorist includes many factors: • Signal control • Geometrics • Incidents
Total delay: • Difference between actual travel time and ideal travel time • In the absence of traffic control, geometric delay, incidents and when there are no vehicles on the road • In HCS only control delay is quantified • initial deceleration delay • Queue move-up time • Stopped delay • Final acceleration delay
Previous versions of HCM/HCS (1994 version or earlier) • Only included stopped time delay
LOS • LOS criteria are stated in terms of average control delay per vehicle • Delay is dependent on • Quality of progression • Cycle length • Green ratio • V/c ratio for lane group • Designated by letters A - F
LOS A • Describes operations with very low control delay, up to 10 sec/veh • Occurs when progression is extremely favorable • When most cars arrive during the green • Most vehicles do not stop at all • Short cycle lengths may also contribute to low delay
LOS B • Describes operations with control delay > 10 and up to 20 sec/veh • Occurs with good progression, short cycle lengths or both • More vehicles stop than with LOS A • Causing higher levels of average delay
LOS C • Describes operations with control delay greater than 20 and up to 35 sec/veh • Fair progression, longer cycle lengths, or both • Individual cycle failures may begin to appear at this level • No. of vehicles stopping is significant • Many still pass without stopping
LOS D • Describes operations with control delay > 35 and up to 55 sec/veh • Influence of congestion becomes more noticeable • Longer delays result • Unfavorable progression • Long cycle lengths • High v/c ratios • Many vehicles stop • Proportion of vehicles not stopping declines • Individual cycle failures are noticeable
LOS E • Describes operations with delay > 55 and up to 80 sec/veh • The limit of acceptable delay • Indicate poor progression, long cycle lengths and high v/c ratios • Individual cycle failures are frequent occurrences
LOS F • Describes operations with delay > 80 sec/veh • Considered unacceptable to most drivers • Occurs with oversaturation • When arrival flow rates exceed the capacity of the intersection • Occurs at high v/c rations below 1.0 with many individual cycle failures • Poor progression and long cycle lengths may also contribute
INPUT • Geometric conditions • Traffic conditions • Signalization conditions Operational Analysis Procedure • 3. SATURATION FLOW RATE • Ideal saturation flow rate • Adjustments • VOLUME ADJUSTMENT • Peak hour factor • Establish lane groups • Assign volumes to lane groups • CAPACITY ANALYSIS MODULE • Compute lane group capacities • Compute lane group v/c ratios • Aggregate results • LEVEL OF SERVICE MODULE • Compute lane group delays • Aggregate delays • Determine levels of service
Default Values • May be used without compromising analysis • Results become approximate • As more default values are used
Default Values for Use • Ideal saturation flow rate = 1,900 pcphpgpl • Conflicting pedestrian volume • None: 0 peds/hr • Low: 50 peds/hr • Moderate: 200 peds/hr • High: 400 peds/hr • Percent heavy vehicles = 2 • Grade = 0 • No. of stopping buses = 0/hr
Parking conditions: No Parking • Parking maneuvers = 20/hr, where parking exists • Arrival type • Lane groups with through movements: • 3 if isolated • 4 if coordinated • Lane group without through movement = 3 • Peak-hour factor = 0.90 • Lane width = 12 feet • Area type = non CBD
Right Turns on Red (RTOR) • When RTOR is permitted • Right turn volume may be reduced • Number of vehicles able to turn right on red is a function of: • Approach lane uses • Right turn demand • Sight distance • Left-turn phasing on conflicting street • Conflicts with pedestrians
Arrival Types • Quantifies the quality of progression • Type 1: dense platoon, arriving at the start of the red, very poor progression • Type 2: Moderately dense platoon arriving in the middle of the red phase, unfavorable progression • Type 3: random arrivals, isolated intersections
Type 4: Moderately dense platoon arriving at the start of the green phase, favorable progression • Type 5:Dense to moderately dense platoon, arriving at the start of the green phase, highly favorable progression • Type 6: exceptional progression quality on routes with near-ideal characteristics
Effective green time • Time that is effectively available to a movement, • generally taken to be the green time plus the clearance interval minus the lost time • Lost time • Time during which the intersection is not effectively used by any movement, which occurs • During the clearance interval • Start-up delay
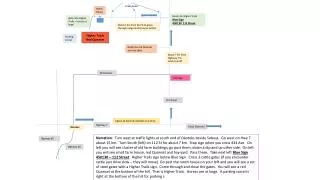
f f 1 2 f3 Example:Evaluate Intersection LOS, Using HCS f f 1 2 G=10.0 sec Y=4.0 AR = 1.0 G=40.0 sec Y=4.0 AR = 1.0 380 140 100 Main Street 100 280 470 f4 940 100 180 G=5.0 sec Y=4.0 AR = 1.0 G=35.0 sec Y=4.0 AR = 1.0 180 First Street 200 760 Assume RTOR Volume is 10% of right turn volume Assume percent trucks (through traffic is 7% Assume PHF = 93%
Unsignalized Intersections • Two types • Two-Way Stop Controlled Intersections (TWSC) • All-Way Stop Controlled Intersections (AWSC) • Capacity- TWSC • Depends on driver interaction of drivers on the minor street approach and drivers on the major street • Gap acceptance models are used in HCS to describe this interaction
Level of Service (LOS)-TWSC • Determined by the computed control delay and is defined for each minor movement. • LOS is not defined for an intersection as a whole
LOS Criteria for Unsignalized Intersections LEVEL OF SERVICE AVG CONTROL DELAY PER VEHICLE (SEC/VEHICLES) £ A 10 B £ >10 and 15 0 C £ >15 and 2 5 D £ >25 and 35 E £ >35 and 5 0 F > 5 0
LOS Criteria for unsignailzed intersections is slightly different than for signalized intersections • Because driver perception is different • Expectation is that a signalized intersection is designed to carry higher traffic volumes and experience greater delay than at unsignalized intersections
Data Input • Similar to those for signalized intersections • Geomerty • Intersection control • Traffic volumes • Key features • Number and uses of lanes • Channelization • Two-way left turn lane (TWLTL) • Raised or striped median storage • Existence of flared approaches on the minor street
Presence of upstream traffic signals on the major street • Produce nonrandom flows • Affect the capacity of the minor street approaches if the signal is within 0.25 miles of the intersection
Critical Gap and Follow Up Time • Critical gap • Minimum time interval in the major street traffic that allows one vehicle in the minor street traffic to enter the main street traffic. • Minimum gap that would be acceptable • A driver would reject any gaps less than the critical gap and would accept gaps greater than or equal to the critical gap. • Follow up time • The time needed for more than one vehicle to complete a turn if an adequate gap is available.