Download
1 / 16
160 likes | 345 Views
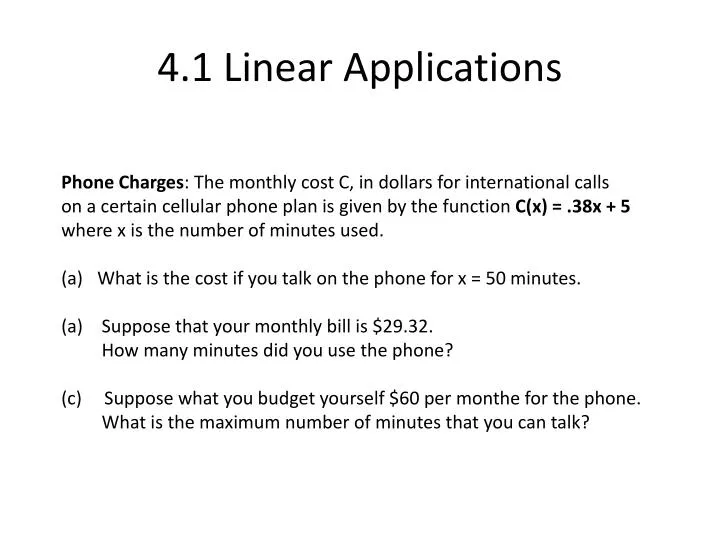
Phone Charges : The monthly cost C, in dollars for international calls on a certain cellular phone plan is given by the function C(x) = .38x + 5 w here x is the number of minutes used. What is the cost if you talk on the phone for x = 50 minutes. Suppose that your monthly bill is $29.32.

E N D
Phone Charges: The monthly cost C, in dollars for international calls on a certain cellular phone plan is given by the function C(x) = .38x + 5 where x is the number of minutes used. What is the cost if you talk on the phone for x = 50 minutes. Suppose that your monthly bill is $29.32. How many minutes did you use the phone? (c) Suppose what you budget yourself $60 per monthe for the phone. What is the maximum number of minutes that you can talk? 4.1 Linear Applications
Application: Supply & Demand Suppose that the quantitu supplied S and quantity demanded D of hot dogs at the baseball game are given by the following functions: S(p) = -2000 + 3000p p is the price of a hot dog. D(p) = 10,000 – 1000p • Find the equilibrium price for hot dogs at the baseball game. What is the equilibrium quantity? • Determine the prices for which quantity demanded is less than quantitu supplied. • What do you think will eventually happen to the price of hot dogs if quantity demanded is less than quantity supplied?
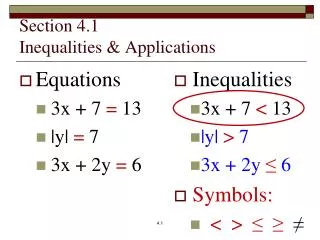
Application: Taxes The function T(x) = .15(x – 7300) + 730 represents the tax bill T of a single person whose adjusted gross income is x dollars for income between $7,300 and $29,700, inclusive in 2005. [ Source: Internal Revenue Service] • What is the domain of this linear equation • What is a single filer’s tax bill if adjusted gross income is $18,000? • Which variable is independent and which is dependent? • Graph the linear function over the domain specified in part (a) • What is a single filer’s adjusted gross income if the tax bill is $2860?
4.3 Quadratic Functions & Graphs y = x2 • x y • 0 0 • 1 • -1 1 • 4 • -2 4 Vertex Lowest (Minimum) point if The parabola opens upward, And highest (Maximum) point if parabola opens downward. A Parabola Do you know what an axis of symmetry is?
Quadratic Functions & Graphs y = x2 - 2 • x y • 0 -2 • -1 • -1 -1 • 2 • -2 2 Vertex Notice this graph is shifted down 2 from the origin. Y = x2 – k (shifts the graph down k units) Y = x2 + k (shifts the graph up k units) To shift the graph to the right or to the left y = (x – h)2 (shifts the graph to the right) y = (x + h)2 (shifts the graph to the left)
General Form of a Quadratic y = ax2 + bx + c a, b, c are real numbers & a 0 A quadratic Equation: y = x2 + 4x + 3 a = _____ b = _____ c = ______ 1 4 3 x y -5 8 -4 3 -3 0 -2 -1 -1 0 0 3 1 8 Formula for Vertex: X = -b 2a Plug x in to Find y Where is the vertex? Where is the axis of symmetry?
Quadratic Equation Forms • Standard Form: • Vertex Form: Vertex = (h, k)
Examples Find the vertex, axis of symmetry, and graph each a. b. c. Vertex (5, 2) Vertex (-2, -3) Vertex (4, -6)
Convert from Vertex Form to Standard Form Vertex Form: y = 2(x + 2)2 + 1 To change to standard form, perform multiplication, add, and combine like terms. y = 2 (x + 2) (x + 2) + 1 y = 2 (x2 + 2x + 2x + 4) + 1 y = 2 (x2 + 4x + 4) + 1 y = 2x2 + 8x + 8 + 1 y = 2x2 + 8x + 9 (Standard Form)
Convert from Standard Form to Vertex Form(Completing the Square – Example 1) Step 1: Check the coefficient of the x2 term. If 1 goto step 2 If not 1, factor out the coefficient from x2 and x terms. Step 2: Calculate the value of : (b/2)2 Step 3: Group the x2 and x term together, then add (b/2)2 and subtract (b/2)2 Step 4: Factor & Simplify Example 1: y = x2 –6x – 1 (Standard Form) (b/2)2 = (-6/2)2 = (-3)2 = 9 y = (x2 –6x + 9) – 1 -9 y = (x – 3) (x – 3) – 1 – 9 y = (x – 3)2 – 10 (Vertex Form)
Convert from Standard Form to Vertex Form(Completing the Square – Example 2) Step 1: Check the coefficient of the x2 term. If 1 goto step 2 If not 1, factor out the coefficient from the x2 and x term. Step 2: Calculate the value of : (b/2)2 Step 3: Group the x2 and x term together, then add (b/2)2 and subtract (b/2)2 Step 4: Factor & Simplify Example 2: y = 2x2 +4x – 1 (Standard Form) y = 2( x2 + 2x) –1 (2/2)2 = (1)2 = 1 y = 2(x2 +2x + 1) – 1 -2 (WHY did we subtract 2 instead of 1?) y = 2(x + 1) (x + 1) – 1 – 2 y = 2(x + 1)2 – 3 (Vertex Form)
Solving Quadratic Equations General Form of a Quadratic Equation y = ax2 + bx + c 0 = ax2 + bx + c (If y = 0, we can solve for the x-intercepts) A quadratic Equation: y = x2 + 4x + 3 a = _____ b = _____ c = ______ 1 4 3 Graphical Solution Numerical Solution Symbolic/Algebraic Solution x2 + 4x + 3 = 0 (x + 3) (x + 1) = 0 x + 3 = 0 x + 1 = 0 x = -3 x = -1 x y -5 8 -4 3 -3 0 -2 -1 -1 0 0 3 1 8 Vertex (-2, -1) Formula for Vertex: X = -b 2a
Number of Solutions y = x2 + 4x + 3 y = x2 - 4x + 4 y = 2x2 + 1 1 Real Solution x = 2 NO Real Solutions (No x-intercepts) 2 Real Solutions x = -3 x = -1
Quadratic Graphing Things to Know • Standard Form of a quadratic: y = ax2 + bx + c • Vertex Form of a quadratic: y = a(x – h)2 + k • Using either form above: • Find and graph the vertex • Use an x/y chart to plot points & graph the parabola • Use and describe transformations to graph the parabola • Use intercepts and symmetry while graphing the parabola. • Show and give the equation for the line of symmetry. • Convert from standard to vertex form and vice vera
4.4 Quadratic Modeling Application Insurance Claims: The years 1999 to 2005 were particularly costly for insurance companies, with 7 of the 10 most costly catastrophes in U.S. history (as of 2005). For the United States Automobile Association (USAA) and its affiliates, the total cost of claims for catastrophic losses, in millions, can be approximated by C(x) = 34.87x2 – 98.1x + 258.3, where x = 0 for 1999, x = 1 for 2000, x = 2 for 2001, and so on. • Estimate the total cost of claims for the year 2003 • According to the model during which year were catastrophic loss claims at a minimum? • Would C(x) be useful for predicting total catastrophic loss claim for the year 2015? Why or why not?