Download
1 / 22
230 likes | 383 Views
CONTINUOUS RANDOM VARIABLES AND THE NORMAL DISTRIBUTION. CONTINUOUS PROBABILITY DISTRIBUTION. Two characteristics The probability that x assumes a value in any interval lies in the range 0 to 1 The total probability of all the intervals within which x can assume a value of 1.0.

E N D
CONTINUOUS PROBABILITY DISTRIBUTION Two characteristics • The probability that x assumes a value in any interval lies in the range 0 to 1 • The total probability of all the intervals within which x can assume a value of 1.0
Area under a curve between two points. Shaded area is between 0 and 1 x = a x = b x
Total area under a probability distribution curve. Shaded area is 1.0 or 100% x
Area under the curve as probability. Shaded area gives the probability P (a ≤x ≤b) a b x
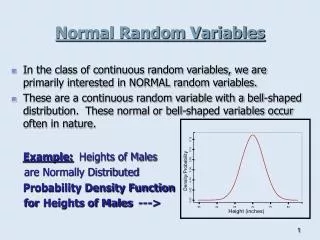
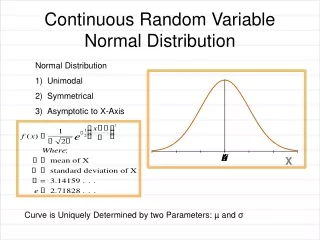
THE NORMAL DISTRIBUTION • Normal Probability Distribution • A normal probability distribution , when plotted, gives a bell-shaped curve such that • The total area under the curve is 1.0. • The curve is symmetric about the mean. • The two tails of the curve extend indefinitely.
Normal distribution with mean μand standard deviation σ. Standard deviation = σ Mean =μ x
Total area under a normal curve. The shaded area is 1.0 or 100% μ x
A normal curve is symmetric about the mean. Each of the two shaded areas is .5 or 50% .5 .5 μ x
Areas of the normal curve beyond μ± 3σ. Each of the two shaded areas is very close to zero μ μ–3σ μ + 3σ x
Three normal distribution curves with the same mean but different standard deviations. σ = 5 σ = 10 σ = 16 x μ = 50
Three normal distribution curves with different means but the same standard deviation. σ = 5 σ = 5 σ = 5 µ = 20 µ = 30 µ = 40 x
THE STANDARD NORMAL DISTRIBTUION • Definition • The normal distribution with μ = 0 and σ = 1 is called the standard normal distribution.
The standard normal distribution curve. σ = 1 µ = 0 z -3 -2 -1 0 1 2 3
THE STANDARD NORMAL DISTRIBTUION • Definition • The units marked on the horizontal axis of the standard normal curve are denoted by z and are called the z values or z scores. A specific value of z gives the distance between the mean and the point represented by z in terms of the standard deviation.
Area under the standard normal curve. Each of these two areas is .5 . 5 . 5 -3 -2 -1 0 1 2 3 z
STANDARDIZING A NORMAL DISTRIBUTION • Converting an x Value to a z Value • For a normal random variable x, a particular value of x can be converted to its corresponding z value by using the formula • where μ and σ are the mean and standard deviation of the normal distribution of x, respectively.
DETERMINING THE z AND x VALUES WHEN AN AREA UNDER THE NORMAL DISTRIBUTION CURVE IS KNOWN • Examples …
Finding an x Value for a Normal Distribution • For a normal curve, with known values of μand σand for a given area under the curve the x value is calculated as • x = μ+zσ