Download
1 / 22
220 likes | 283 Views
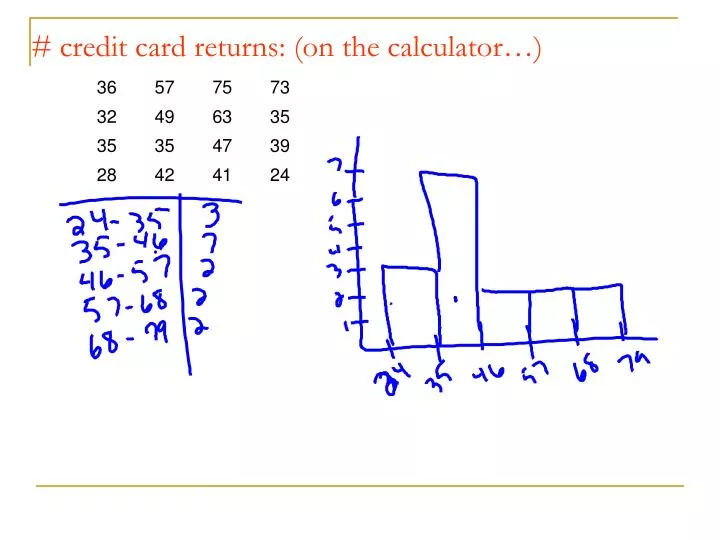
# credit card returns: (on the calculator…). Quantitative Graphs. Central Tendency. Center. Roughly describes where the center of the data is in the set. Can use the mean or the median. Mean. Sample:. Population:.

E N D
Center • Roughly describes where the center of the data is in the set. • Can use the mean or the median
Mean Sample: Population:
The following show the # of hours spent by college professors in teaching and advising. Find the average # of hours they spend teaching & advising. Show your Work – including the formula that you used!
The 50 states plus the District of Columbia have a total of 3137 counties. There are a total of 248,709,873 people in each of these counties. Find the average population per county.
What if I used the Almanac Book of Facts and chose a few samples? Sample 1 20,095 108,978 15,384 13,931 24,960 Sample 2 28,895 10,032 16,174 959,275 30,797 Sample 3 16,934 519 73,478 14, 798 13,859
We’ll study this further to see how to be able to use samples to predict the populations better.
Median • This is the value in the middle • 50% of the data is above and below this value.
Find the Median – first put the values in order (smallest to largest) 6, 8, 12, 14, 17 Median = 12 7, 15, 22, 23, 27, 28
Find the mean & median of the following tests grades. Stemplot:
The mean is greatly affected by outliers – it’s very sensitive to them – which means it is pulled towards the outlier.The median is insensitive to outliers. It’s often used more because it is more stable.
Examples • Average salaries of professional football players. • Scores on a test when there’s one that hasn’t been made up yet. • Average salaries of 1st year teachers
Proportion of Success: M F F F M F M F M M F F F M Proportion of Females For a Population use π.
Trimmed Mean Order the data – delete a selected number of values from each end of the list then average the remaining values. Trimming Percentage: It’s the percent of values trimmed from the list.
Dive Scores Let’s do a 10% trim.
Ed took 5 tests and his average was 85. If his average after the first three tests was 83, what’s the average of the last two tests.
On Thursday, 20 out of 25 students took a test and their average was 80. On Friday, the other 5 students took it and their average was 90. What was the class average?
The first 3 hours of a trip, Susan drove 50 mph. Due to delays, she drove 40 mph for the next 2 hours. What was her average speed?
Ed’s average on 4 tests is 80. What does he need to get on the 5th test to raise his average to an 84?