Download
1 / 10
100 likes | 415 Views
Groundwater Recharge and Groundwater Quality Issues. Vincent W. Uhl, PH, PG Vincent Uhl Associates, Inc. Lambertville, NJ Slides 1 to 10. Presentation Summary. Assess Groundwater Resources from a Growth – Management Perspective Look at Limitations and Opportunities

E N D
Groundwater Recharge and Groundwater Quality Issues Vincent W. Uhl, PH, PG Vincent Uhl Associates, Inc. Lambertville, NJ Slides 1 to 10
Presentation Summary • Assess Groundwater Resources from a Growth – Management Perspective • Look at Limitations and Opportunities • Local Planning to Protect Water Resources • Tools needed to accomplish this planning
Hunterdon Aquifers • Piedmont (Brunswick, Lockatong, Stockton) • Highlands (PreCambrian and Limestone) • Sourlands and Cushetunk Mountain (diabase)
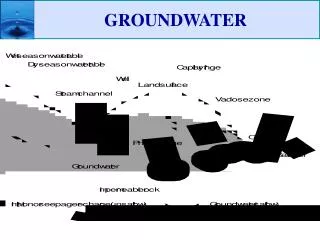
Water Budget Overview • P = R + I + ET • P = Precipitation • R = Runoff • I = Infiltration (Recharge) • ET = Evapo-transpiration • Annual Averages usually used
Infiltration ≈ Baseflow • Recharge to ground water eventually flows to streams unless taken out through wells
GW Recharge • Soils, precipitation, land cover • Part moves “quickly” to streams • Part moves to aquifers and then “slowly” to streams or wells
Groundwater Recharge – Ways to Estimate • Sophisticated Water Balance (See Van Abs Slide 4) • NJGS Method • Recharge as a fixed percentage of precipitation • Baseflow Analysis • Very Conservative – e.g. 7day 10 year low flow • Average Baseflow • DRBC Approach in SE PA Watersheds which is 75% of the 25-year recurrence baseflow.
Recharge Estimates – The Math • Recharge is often expressed as gallons per day per square mile (gpd/mi2) • Examples for the Highlands Precambrian Rock aquifers: • 7 day 10 year low flow – 85,000gpd/mi2 • Average annual base flow – 525,000 gpd/mi2 • 75% of 25-year baseflow recurrence interval – 225,000 gpd/mi2
640 acres in a square mile. 85,000 gpd/mi2 525,000 gpd/mi2 225,000 gpd/mi2 130 gpd/acre 820 gpd/acre 350 gpd/acre Translating Recharge to:Gallons per day per acre
Using 400 gpd/household 130 gpd/acre 820 gpd/acre 315 gpd/acre 3 acre lots 0.5 acre lots 1.25 acre lots Translating Gallons per day per acre of recharge to lot sizes Go to Slides 11 to 23