Download
1 / 152
1.52k likes | 1.8k Views
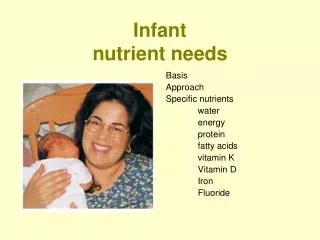
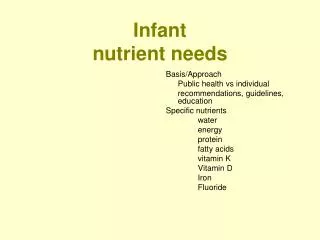
Infant nutrient needs. Basis/Approach Public health vs individual recommendations, guidelines, education Specific nutrients water energy protein fatty acids vitamin K Vitamin D Iron Fluoride. Growth and development Physiology GI Renal Programming

E N D
Infantnutrient needs Basis/Approach Public health vs individual recommendations, guidelines, education Specific nutrients water energy protein fatty acids vitamin K Vitamin D Iron Fluoride
Growth and development Physiology GI Renal Programming Public health vs individual Optimize growth and development Prevent deficiencies Safety Prevention of chronic illness and optimize health through life cycle Basis of recommendations
Approaches to Estimating Nutrient Requirements • Direct experimental evidence (ie protein and amino acids) • Extrapolation from experimental evidence relating to human subjects of other age groups or animal models • ie thiamin--related to energy intake .3-.5 mg/1000 kcal • Breast milk as gold standard (average [] X usual intake) • Metabolic balance studies (ie protein, minerals) • Clinical Observation (eg: manufacturing errors B6, Cl) • Factorial approach • Population studies
Challenges • Strength of Evidence • Individual vs population • Public health approach • Individual genetics • Maternal-infant dyad • In utero endowment • Beliefs, values, choices • Relationship/nurture • Environmental factors
Public health vs individual • Prevalence of nutrient deficiencies • Balance incidence, burden, and treatment • Eg: Vitamin K and hemorrhagic disease of newborn • Prevalence and evidence of chronic conditions associated with dietary practices • Etiology of nutrient deficiencies and/or chronic conditions • Eg: allergy, obesity, anemia, dental caries,…
Individual Requirements • Genetics • Adaptation • Environment • Behavior/activity • Choices, access, resources • other
1940’s • Rickets (D) • Pellagra (Niacin) • Scurvy (C) • Beriberi (Thiamin) • Xeropthalmia (A) • Goiter (Iodine)
United Nations 5th report on World Nutrition: March 2004 • Vitamin A deficiency • 140 million preschoolers • 7 million pregnant women • Iron Deficiency • One of most prevalent • 4-5 billion affected
Causes Nutrition - Disease Access Food Health Care Environment Economics Education
Nutrient composition in early diet may have long term effects on GI function metabolism and health Animal models show that glucose and amino acid transport activities are programmed by composition of early diet Animals weaned onto high CHO diet have higher rates of glucose absorption as adults compared to those weaned on high protein diet Barker Hypothesis: Association between BMI and chronic disease: HTN and cardiovascular, SGA/IUGR Other examples: early diet associations with allergy, obesity, diabetes Programming by Early Diet
Allergies: Prevention by Avoidance (Zeigler, Pediatr Allergy Immunol. 1994) • High risk infants from atopic families, intervention group n=103, control n=185 • Restricted diet in pregnancy, lactation, Nutramagen when weaned, delayed solids for 6 months, avoided highly allergenic foods • Results: reduced age of onset of allergies
Allergies: Prevention by Avoidance(Zeigler, Pediatr Allergy Immunol. 1994)
Allergies: Early Introduction of Foods(Fergussson et al, Pediatrics, 1990) • 10 year prospective study of 1265 children in NZ • Outcome = chronic eczema • Controlled for: family hx, HM, SES, ethnicity, birth order • Rate of eczema with exposure to early solids was 10% Vs 5% without exposure • Early exposure to antigens may lead to inappropriate antibody formation in susceptible children.
Early Introduction of Foods(Fergussson et al, Pediatrics, 1990)
Allergies: Prevention by Avoidance (Marini, 1996) • 359 infants with high atopic risk • 279 in intervention group • Intervention: breastfeeding strongly encouraged, no cow’s milk before one year, no solids before 5/6 months, highly allergenic foods avoided in infant and lactating mother
Cochrane Review • Osborn et al: Formulas containing hydrolysed protein for prevention of allergy and food intolerance in infants 2006;18 • Concluded that use of hydrolysed formula in non breastfed infants at risk for allergy (atopic dermatitis) for at least 4 months reduces the incidence of allergy.
DRI • Nutrition Recommendations from the Institute of Medicine (IOM) of the U.S> National Academy of Sciences for general public and health professionals. • Hx: WWII, to investigate issues that might “affect national defense” • Population/institutional guidelines • Application to individuals.
DRI • Estimated Average Requirement (EAR): expected to satisfy the needs of 50% of the people in that age group based on review of scientific literature. • Recommended Dietary Allowance (RDA): Daily dietary intake level considered sufficient by the FNB to meet the requirement of nearly all (97-98%) healthy individuals. Calculated from EAR and is usually 20% higher • Adequate intake (AI): where no RDA has been established. • Tolerable upper limit (UL): Caution agains’t excess
DRI’s for infants • Macronutrients based on average intake of breast milk • Protein less than earlier RDA • Energy: EER
DRI’s for infants • Macronutrients based on average intake of breast milk • Protein less than earlier RDA • AAP Recommendations • Vitamin D: 200 IU supplement for breastfed infants and infants taking <500 cc infant formula • Iron: Iron fortified formula (4-12 mg/L), Breastfed Infants supplemented 1mg/kg/d by 4-6 months
Feeding Guidelines and Recommendations • Public health policy • Health promotion • Prevention
Recommendations/guidelines • DRI: Dietary Reference Intakes • AI • UL • EER • AAP • Bright Futures • Start Healthy feeding guidelines
Comparison of individual intake data to a reference or estimate of nutrient needs • DRI: Dietary Reference Intakes • periodically revised recommendations (or guidelines) of the National Academy of Sciences • quantitative estimates of nutrient intakes for planning and assessing diets for healthy people AI: Adequate Intake UL: Tolerable Upper Intake Level EER: Estimated Energy Requirement
DRI’s for infants • Macronutrients based on average intake of breast milk • Protein less than earlier RDA • Factors to consider: fetal endowment, individual variability, impact of diet on bioavailability and need
The Start Healthy Feeding Guidelines for Infants and Toddlers (JADA, 2004)
Bright Futures AAP/HRSA/MCHB http://www.brightfutures.org “Bright Futures is a practical development approach to providing health supervision for children of all ages from birth through adolescence.”
Examples • Transition • Supplements to breastmilk • Safety • Allergy prevention • Dental health • other
Water • Water requirement is determined by: • water loss • evaporation through the skin and respiratory tract (insensible water loss) • perspiration when the environmental temperature is elevated • elimination in urine and feces. • water required for growth • solutes derived from the diet
Water • Water lost by evaporation in infancy and early childhood accounts for more than 60% of that needed to maintain homeostasis, as compared to 40% to 50% later in life • NAS recommends 1.5 ml water per kcal in infancy.
Limited ability to concentrate urine in first year due to immaturities of nephron and pituitary Potential Renal solute load determined by nitrogenous end products of protein metabolism, sodium, potassium, phosphorus, and chloride. Renal
Most normal adults are able to achieve urine concentrations of 1300 to 1400 mOsm/l Healthy newborns may be able to concentrate to 900-1100 mOsm/l, but isotonic urine of 280-310 mOsm/l is the goal In most cases this is not a concern, but may become one if infant has fever, high environmental temperatures, or diarrhea Urine Concentrations
Renal solute load • Samuel Foman J Pediatrics Jan 1999 134 # 1 (11-14) • RSL is important consideration in maintaining water balance: • In acute febrile illness • Feeding energy dense formulas • Altered renal concentrating ability • Limited fluid intake
Water • Individual needs • Renal concentrating ability • Solute in diet • Health • environment
Water vs fluid • Concentrating formula decreases free water and increases RSL • What is the % water in 20 kcal/oz infant formula? • 90% • To achieve 100 ml/kg/d needs to consume at least 110 cc/kg/d
Energy Requirements • Higher than at any other time per unit of body weight • Highest in first month and then declines • High variability - SD in first months is about 15 kcal/kg/d • Breastfed infants many have slighly lower energy needs • RDA represents average for each half of first year
Energy Requirements, cont. • RDA represents additional 5% over actual needs and is likely to be above what most infants need. • Energy expended for growth declines from approximately 32.8% of intake during the first 4 months to 7.4% of intake from 4 to 12 months
EER • 0-3 months (89 x wt -100) + 175 • 4-6 months (89 x wt -100) + 56 • 7-12 months (89 x wt -100) + 22 • 13-35 months (89 x wt -100) + 20 • Equations for older children factor in weight, height and physical activity level (PAL)
Energy Correlate individual intake with growth
Protein • Increases in body protein are estimated to average about 3.5 g/day for the first 4 months, and 3.1 g/day for the next 8 months. • The body content of protein increases from about 11.0% to 15.0% over the first year