Download
1 / 16
170 likes | 636 Views
Population Aging. Gero 300 Lecture #2 9/9/2008. Assessing Population Aging.

E N D
Population Aging Gero 300 Lecture #2 9/9/2008
Assessing Population Aging • Three Measures-% aged 65 + A population with >10% over 65 is considered old. In 1999 Stats Can found 12.3% of Canadian Pop > 65, therefore we are considered to have an old population-as the % > the pop ages. Note: populations are not homogenious, not all 65 year olds are the same, the aged are divided into categories, income and social status differ, as does housing
Pop Aging • Housing and household structures. • Second concept is Median Age-one half the pop is older and half younger. As the median age increases the population ages. Stats Can 2000-median age is 36.8. A median age of 30 indicates an old population • Third concept-Dependency ratios-dependent age groups are considered a social burden or responsibility. Working over non working population 15-64/65+ Aged-Youth and Total Dependency ratios. In 2000-183/1000
Dependency Ratio • In these calculations it is important to factor in fertility and mortality rates • Familial old age dependency ratio-# of elderly parents 64-84 to children who would support them 45-54. Here we must watch assumptions of economic dependence/independence, unpaid contributions, unpaid homemaking etc. and economic usefulness tied only to paid labour.
Canada’s Aged • How has the pop aged over past 150 years and what are future predictions. Pop has been aging and forecast to age from 1881-2036 • Boomers born 1946-62 will enter old age in 2011 • Between 2011-2027 substantial increase in the aged in Canada. • Increasing number and % of 80+ in pop. In 2000 they made up 3% of pop. In 1961 it was 1.4% • In world terms we are <Europe but> than others • We have to be aware of absolute numbers
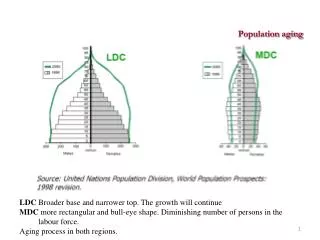
Causes of pop aging • Fertility-we have declining fertility, therefore the aged increase by default. We have to consider family size and numbers of children • Factors to consider-urbanization, declining value of children in cities, decline of family wage and increase of women in the labor force, increasing levels of education esp. for women,delaying reproduction. • Pop pyramids-proportion of males/females in age groups-see fig 1.2 Future pyramids take on stationary shape-decline in fertility
Mortality decline • Concepts-life expectancy-number of years expected to live in country/pop. Identical to longevity. LE uses life table analysis (Box 1.2) and longevity is not a statistical concept. Life span-number of years a human could live under ideal conditions. • LE has > in 20 Century particularly after 1961 for 65+. LE starts with youth and filters to old age. • NIA feels we are approaching bio fixed finite life span
Life Span • Possibly 85-100-subject to bio-medical and technological breakthroughs • Based on dependency free, disability free years and functional life expectancy. • Compression morbidity-increasing # of people can postpone onset of chronic disability, serious illness or disablement and death is therefore compressed • No evidence to support, females live longer and spend more time in poorer health
Immigration/Migration • We would need 600,000 immigrants per year to impact aging structure. Target is 200-225,000 and this is likely to be more limited in the future. • Causes of Death-please read pages 13-17 and study table 3.3 in the Fact Book
Differentials in Pop Aging • Gender-1998-2.1 million women 65+ 1.6 million males. 58% of the senior pop. 85+ 70% are female (mortality and LE) and lower death rates for most causes of death. • Gender and mortality-there is a biological base-fetus may be weaker etc (read page 18 Fact Book) • Causes of death widen gender mortality differential-circulatory and ischemic heart disease. Malignant neoplasms-shifting trends and patterns of mortality-see table 3.4b Fact Bk
Factors to consider • Women’s lung cancer rates have increased, gender gap and mortality is directly co-related to education and socio-economic status • Women have better social support systems, increased resilience factors, less social isolation • In the future seniors will be more ethnically diverse • First Nation senior pop is aging rapidly • Migration patterns-have not to have Provinces
Residence and Migration • 76% of seniors live in urban areas. 24% in rural face unique problems-family support, transportation, facilities and services • Canadian cities vary widely in age structures-Victoria 18.2% aged Calgary 9% • Amenity oriented migration patterns-older Canadians less likely to move and when they do it is closer to family due to declining health and to smaller homes with adaptations
Residence • Snowbirds-250,000 seniors migrate to South-relatively young, married and > incomes with good health and few chronic conditions.
Apocalyptic Demography • Does our aging society have catastrophic consequences. Can society afford the increasing number and percentages of older people in society • Five themes-aging is a social problem, stereotyping of the aged, blaming the elderly, intergenerational injustice (getting more than their fair share), aging and social policy is guiding maxim of Canadian Welfare State.
AD • This could include the suggestion to dismantle Senior Benefit programs such as OAS, GIS, tax credits, privatization, claw-backs. • Should generations be inter-dependent and this already exists informally. Private transfers of goods and services are often not recognized and it is hard to obtain data on these. • Critiques include: relatively unchanged dependency ratio, decrease in youth DR, economic growth and productivity factors
AD • Half elderly females live in poverty and are often invisible. Evans (UBC) argues pop aging is not as important as physician billings, prescription drug costs, new technologies, hospital use. All of these negate the importance of age structure. • Spending on social programs is not as important a factor as inflation and interest rates and government debt loads. • Pop aging is a political issue and puts free market proponents up against social welfare agendas