Download
1 / 29
290 likes | 417 Views
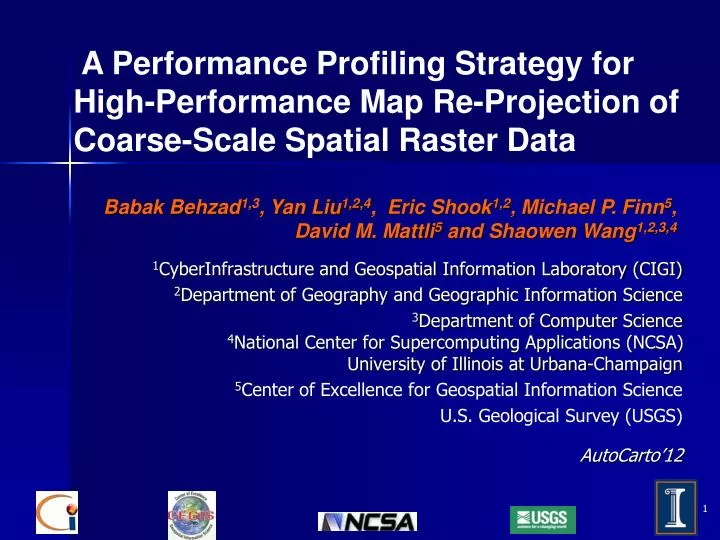
A Performance Profiling Strategy for High-Performance Map Re-Projection of Coarse-Scale Spatial Raster Data. Babak Behzad 1,3 , Yan Liu 1,2,4 , Eric Shook 1,2 , Michael P. Finn 5 , David M. Mattli 5 and Shaowen Wang 1,2,3,4.

E N D
A Performance Profiling Strategy for High-Performance Map Re-Projection of Coarse-Scale Spatial Raster Data Babak Behzad1,3, Yan Liu1,2,4, Eric Shook1,2, Michael P. Finn5, David M. Mattli5 and Shaowen Wang1,2,3,4 1CyberInfrastructure and Geospatial Information Laboratory (CIGI) 2Department of Geography and Geographic Information Science 3Department of Computer Science 4National Center for Supercomputing Applications (NCSA) University of Illinois at Urbana-Champaign 5Center of Excellence for Geospatial Information Science U.S. Geological Survey (USGS) AutoCarto’12
Outline • Overview • Map re-projection • pRasterBlaster: HPC Solution to Map Re-Projection • Performance Profiling • pRasterBlaster Computational and Scaling Bottlenecks • Conclusion
Introduction • Map re-projection • A important cartographic operation • Desktop application: mapIMG • Challenges exist when scaling for coarse-scale spatial dataset • Re-projecting a 1GB raster dataset can take 45-60 minutes • Parallel computing techniques will help scaling to large datasets • Raster was born to be parallelized
Parallelizing Map Re-Projection Map re-projection on large dataset is too slow or even impossible on desktop machines pRasterBlaster mapIMG in HPC (High-Performance Computing) environment Early Days Row-wise decomposition I/O occurred directly in program inner loop Rigorous geometry handling and novel resampling Resampling options for categorical data and population counts (also standard continuous data resampling methods) Able to project/re-project large maps in short amount of time
pRasterBlaster • Fast and accurate raster re-projection in three (primary) steps • Step 1: Calculate and partition output space • Step 2: Read input and re-project • Step 3: Combine temporary files
Performance Profiling: Motivation and Objectives • Exploit performance profiling tools to make pRasterBlaster more scalable and efficient • Early version was not scalable to large number of processors • Resolve computational bottlenecks to allow pRasterBlaster leverage thousands of processors • Demonstrate techniques of using performance profilers • Potentially useful many GIS applications
What is performance profiling? • A form of dynamic program analysis • Measures • memory footprint of program • time complexity of program • usage of particular instructions • frequency and duration of function calls • Aids program optimization
How do profilers work? • Statistical profilers • Operate by sampling • Probes the program at regular intervals • Pros: Low overhead • Cons: Typically less numerically accurate and specific
How do profilers work? • Instrumenting profilers • Instrument target programs with additional instructions to collect required information • Pros: Much more accurate than statistical profilers • Cons: Potentially slow the program (since new instructions are added) • Different kinds of instrumenting profilers • Manual instrumenting • Done by the programmers • Automatic profilers • Software instruments automatically • TAU and IPM used in this research.
Manual Instrumenting • The traditional way of instrumenting C code is with the time system call, provided by the time.h library. Here is a code fragment that demonstrates its use: #include <sys/time.h> intmain(void) { time_tstart, finish; ... time(&start); /* section to be timed */ time(&finish); printf("Elapsed time: %d\n", finish - start); ... ... }
Manual Instrumenting in Parallel Programs • Instrument the portion of the program running on individual processors #include <sys/time.h> intmain(void) { time_tstart, finish; ... time(&start); /* section to be timed */ time(&finish); printf("Elapsed time on Process %d: %d\n", my_rank, finish - start); ... ... }
IPM(Integrated Performance Monitoring) • IPM is a portable profiling infrastructure for MPI programs • Provides a low-overhead performance profile of the performance aspects and resource utilization of the parallel program • Communication, computation, and IO are the primary focus • http://ipm-hpc.sourceforge.net • We initially profiled pRasterBlaster with IPM to understand how communication, computation and IO usage breakdown for this application
TAU(Tuning and Analysis Utilities) • TAU performance system is a portable profiling and tracing toolkit • Analysis of parallel programs written in Fortran, C, C++, Java, Python • http://tau.uoregon.edu • TAU is capable of gathering performance information through instrumentation of functions, methods, basic blocks, and state • IPM is designed to profile MPI applications, while TAU is used to profile any kind of parallel applications
Cause: Workload Distribution Issue N rows on P processor cores When P is small When P is big
Solution: Load Balancing N rows on P processor cores When P is small When P is big 20
Computational Bottleneck I: Summary • Symptom • Load imbalance • Detected by TAU first • Verified by manual instrumenting • Cause • Workload distribution algorithm problem (not obvious on small platforms) • Solution • Revised algorithm for distributing workload
Computational Bottleneck II: Analysis • Spatial data-dependent performance anomaly • The anomaly is data dependent • Four corners of the raster were processed by processors whose indexes are close to the two ends • Exception handling in C++ is costly • Coordinate transformation on nodata area was handled as an exception • Solution • Remove C++ exception handling part
Computational Bottleneck II: Summary • Symptom • Processors responsible for polar regions spent more time than those processing equatorial region • Cause • Corner cells were mapped to invalid input raster cells generating exceptions • C++ exception handling was expensive • Solution • Removed C++ exception handling • Corner cells need not to be processed • They now contribute less time of computation
Conclusions • Performance profiling identified computational bottlenecks in pRasterBlaster • We demonstrated the value of profilers for pRasterBlaster • The techniques is likely valuable for other GIS application • Performance profiling is an important tool for developing scalable and efficient high performance applications
Future Work • Identify and resolve remaining performance issues in pRasterBlaster • Recently identified I/O is the next major road-block