Download
1 / 23
230 likes | 240 Views
Characteristics of Edge Turbulence in HSX. W.A. Guttenfelder, D.T. Anderson, S.P. Gerhardt, C.H. Lechte, J.N. Talmadge U. of Wisconsin, Madison. Abstract.

E N D
Characteristics of Edge Turbulence in HSX W.A. Guttenfelder, D.T. Anderson, S.P. Gerhardt, C.H. Lechte, J.N. Talmadge U. of Wisconsin, Madison 2003 APS Meeting, Albuquerque, New Mexico
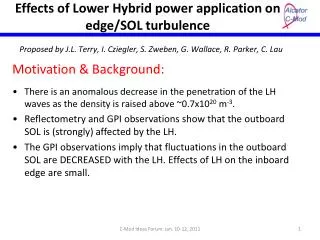
Abstract Langmuir probes have been used to measure electrostatic fluctuations in the edge plasma of the University of Wisconsin-Madison Helically Symmetric eXperiment (HSX) stellarator. The measured floating potential and transport profiles display a complex dependence on line averaged density. At densities below ~1.7 1012 cm-3, transport is measured to be inward at the edge. Above this density, the measured transport is outward, with the direction change experimentally explained by the direction change in measured phase velocity. Floating potential profiles indicate a change in radial electric field from positive to negative above this density threshold. Data has also been acquired with a probe that has access to the high field side of the plasma edge in a region of good curvature. Initial measurements with this probe (below the threshold density stated above) . 2003 APS Meeting, Albuquerque, New Mexico
Outline of this Poster • Description of probes and measurement locations • HSX plasma operation • Density dependence of measured profiles and transport • Comparison of low field side and high field side data • Conclusions 2003 APS Meeting, Albuquerque, New Mexico
HSX Uniquely Allows Probe Access to Regions of Good and Bad Curvature • Fluctuation probes located: (1) on the low field side (LFS) near a box port, (2) on the high field side (HFS) near a joint flange. High field side probe Low field side probe 2003 APS Meeting, Albuquerque, New Mexico
Four tungsten probe tips (3.2 mm 0.74 mm) separated poloidally by 3.2 mm Fourth tip recessed radially 6.4 mm. Three of four probe tips are roughly aligned on a vacuum flux surface. Vfloat1 Isat Vfloat2 Vfloat3 Probes Used Low field side probe High field side probe Outboard side Outboard side 2003 APS Meeting, Albuquerque, New Mexico
Estimation of Particle Transport • Particle flux from electrostatic fluctuations is estimated via (t) = n`(t)Vr`(t) = n`(t)E`(t)/B where E = -Vfloat = (Vf2 – Vf1)/d n = Isat/(0.6eAprobecs) • Alternatively (Powers, Nucl. Fusion 14 (1974) 749)… (f) = Re{N*(f)E(f)}/B = |PnE(f)| cos[nE(f)]/B • -or- (f) = k(f) n(f)|N(f)||(f)| sin(n(f)) /B • Te fluctuations have been neglected. 2003 APS Meeting, Albuquerque, New Mexico
HSX Plasma • HSX |B| spectrum is quasi-helically symmetric (n=4, m=1), resulting in a predicted reduction of neoclassical transport. • Anomalous transport is expected to dominate. • A n=4, m=0 mirror field can be added to break the symmetry. • Typical line averaged density between 3 1011 – 2.5 1012 cm-3. • Stored energies ~20 J for QHS and Mirror configurations (50 kW of 28 GHz ECH). Typical discharge parameters Edge parameters Te ~ 40 eV B ~ 0.45 T s ~ 1.5 mm Stored Energy Density H 2003 APS Meeting, Albuquerque, New Mexico
Raw Probe Data Displays Large Fluctuation Amplitudes and Fast Time Scales • Time series similar to other magnetic toroidal experiments • Electrostatic transport bursty in nature • Power spectra indicate broad frequencies. (t) <(t)> -5 spectral index (for reference) s 2003 APS Meeting, Albuquerque, New Mexico
Mean float & Profiles Display Complex Dependence on Density • Isat profiles roughly overlap when normalize by density. • Floating potential profiles indicate Er transitions from positive to negative at some density. • Measured particle transport is inward at lower densities. outward inward 2003 APS Meeting, Albuquerque, New Mexico
Mean float & Display Complex Dependence on Density • Density scan performed with probe located at r/a ~ 0.8 • Floating potential continuously drops reduction in Er. • Measured particle transport is inward at line averaged densities below ~1.7 1012 cm-3. outward inward 2003 APS Meeting, Albuquerque, New Mexico
Change in Transport Direction Corresponds With Phase Velocity (k) • Power weighted n- phase remains negative. • Power weighted poloidal wavenumber changes direction, indicating change in phase velocity direction. • n sign remains same k changes sign • ~ k sin(n) changes sign sk ~ 0.1 Ion diamagnetic direction Electron diamagnetic direction 2003 APS Meeting, Albuquerque, New Mexico
Phase Velocity is Correlated with the Local Er Measured by float • Two tips measuring floating potential radially separated 6 mm to estimate Er (no Te dependence included). • Poloidal phase velocity calculated using two probe method (Levinson et al., Nucl. Fusion 24 (1984) 527). Vphase Estimated EB velocity Sl(k,) k (cm-1) f (kHz) 2003 APS Meeting, Albuquerque, New Mexico
Evidence for a Non-thermal Electron Population • Comparison of ECE and TS data suggests the existence of non-thermal electrons at lower density plasmas. • Discrepancy disappears near line averaged densities of ~1.7 - 2.0 1012 cm-3. • See K. Likin’s poster for more information on ECE, and K. Zhai for Thomson Scattering. ECE signal sensitive to non-thermal electron population. 2003 APS Meeting, Albuquerque, New Mexico
How Does the Existence of Non-thermal Electrons Complicate the Interpretation of Langmuir Probe Data? • Why the change in fluctuation induced electrostatic transport direction? • Does the population of super-thermal electrons complicate probe interpretation via: • Non-saturated Isat measurement • Secondary electron emission contaminating the floating potential measurement • Phase relation of Isat and Vfloat (e.g., Te fluctuations) • Or do the super-thermals affect the equilibrium Er Vph/k • These are currently unanswered questions. 2003 APS Meeting, Albuquerque, New Mexico
A Comparison of Low Field Side and High Field Side Probe Data • This data is at a “lower” density - 1.0 1012 cm-3. • Isat profiles overlap in r/a coordinates (determined by flux surface mapping and experimentally choosing a separatrix). • Floating potentials agree outside r/a ~ 0.8. • Because of expanded flux surfaces, the high field side probe is more perturbative for r/a < 0.8. • Transport is similar, but smaller in magnitude at high field side. 2003 APS Meeting, Albuquerque, New Mexico
Fluctuation Amplitudes Differ Between LFS & HFS probes at the Edge • In the edge region (0.85 < r/a < 1.0), fluctuation amplitudes differ between LFS and HFS data. • Isat`/<Isat> reduced about 25% on HFS, Vf` reduced a factor of ~2. • HSX has a low % hill outside r/a ~ 0.8. • Within r/a = 0.8, Isat`/<Isat> deviates substantially – HFS probe perturbation? 2003 APS Meeting, Albuquerque, New Mexico
At r/a ~ 0.85, • Fluctuations are distributed over lower frequencies on the high field side – less Doppler shift due to reduced Er (expanded flux surfaces) and therefore smaller EB drift. • This is evident in Vph & k. • Two peaks apparent on the HFS measurements, f ~ 45 & 90 kHz. Vph ~ 2.5 km/s Vph ~ 9.6 km/s 2003 APS Meeting, Albuquerque, New Mexico
Phase Velocities on High Field Side are Reduced • Because of expanded flux surfaces on the high field side, Er = dV/dr is smaller Vphase is smaller. 2003 APS Meeting, Albuquerque, New Mexico
Conclusions 2003 APS Meeting, Albuquerque, New Mexico
Continuing Work • Further characterize the more thermal plasmas at densities 2 1012 cm-3. • Investigate the effects of biased electrode discharges on turbulent fluctuations and ES particle transport. • With the flexibility of the auxiliary coil set, measure the effect of magnetic well depth on electrostatic fluctuation amplitudes and transport. 2003 APS Meeting, Albuquerque, New Mexico
Copies 2003 APS Meeting, Albuquerque, New Mexico
Fluctuation Amplitudes and Spectra Also Change with Density • Vfloat and Isat fluctuation amplitudes decrease above ~1.7 1012 cm-3. • A large reduction in high frequencies (f>200 kHz) for Isat. Change in transport direction 2003 APS Meeting, Albuquerque, New Mexico
Vphase profiles 2003 APS Meeting, Albuquerque, New Mexico