Download
1 / 1
50 likes | 427 Views
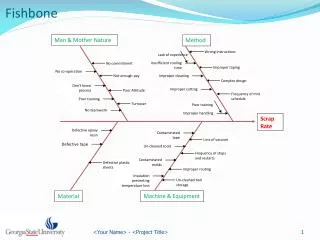
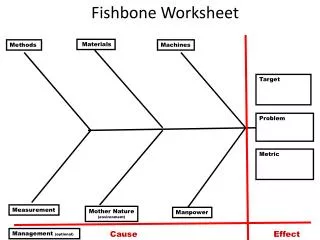
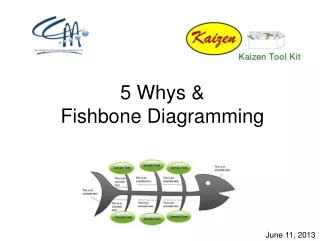
Ishikawa (Fishbone) Diagram. Category. Example: People. Example: Environment. Usage: (often) product design + quality issues Typical categories : people, methods, machines, materials, measurements, environment Can be combined with 7 Ps or 7-S Framework

E N D
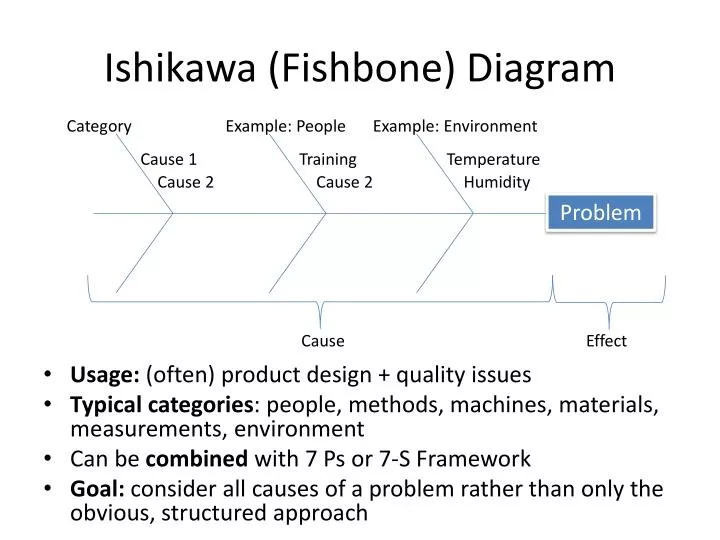
Ishikawa (Fishbone) Diagram Category Example: People Example: Environment • Usage: (often) product design + quality issues • Typical categories: people, methods, machines, materials, measurements, environment • Can be combined with 7 Ps or 7-S Framework • Goal: consider all causes of a problem rather than only the obvious, structured approach Cause 1 Training Temperature Cause 2 Cause 2 Humidity Problem Cause Effect