Download
1 / 33
330 likes | 447 Views
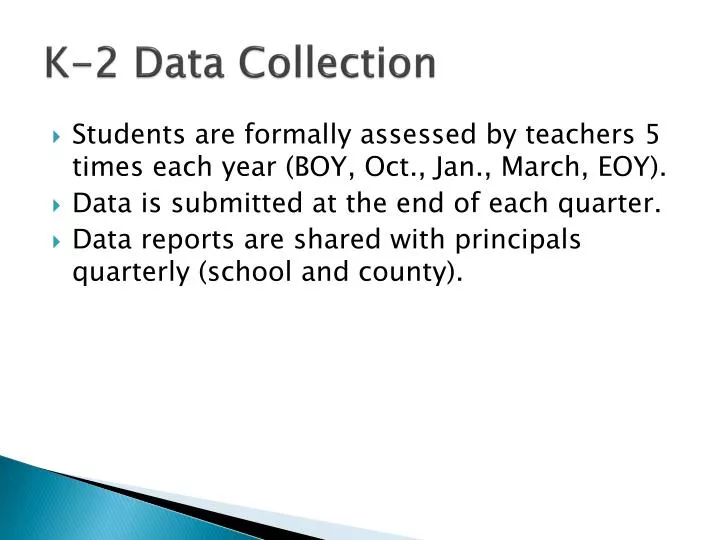
K-2 Data Collection. Students are formally assessed by teachers 5 times each year (BOY, Oct., Jan., March, EOY). Data is submitted at the end of each quarter. Data reports are shared with principals quarterly (school and county). Students Meeting EOY Benchmark.

E N D
K-2 Data Collection • Students are formally assessed by teachers 5 times each year (BOY, Oct., Jan., March, EOY). • Data is submitted at the end of each quarter. • Data reports are shared with principals quarterly (school and county).
Middle School Common Exams August 29, 2013
Opportunities to Grow • Utilize school and district PLT’s to share best practices • More detailed pacing guides for Social Studies and Science • On going professional development on Social Studies and Science content, writing and lesson planning • Utilize more information on Common Exams from DPI
Harnett County Schools Harnett County Schools Career & Technical Education District Meeting Career & Technical Education
Celebrations • North Carolina’s Graduation Rate for CTE Concentrators is 94%. (2011-2012) • Harnett County’s Graduation Rate for CTE Concentrators is 89.4%. (2011-2012) • 1,454 Workplace Credentials were earned by Harnett County High School students in 2012-2013.
Certifications & Credentials Earned in Harnett County • Microsoft Office Word/Expert • Microsoft Office Excel/Expert • Microsoft Office Power Point • Microsoft Office Access • CPR • Fire Technology Modules • First Aide • Nurse Aide • NCCER Modules (Carpentry, Masonry, & Electrical) • NIMS Measurement, Materials, and Safety • ServSafe • WorkKeys
Moving Forward in CTE • Increase the numbers of job shadowing experiences, internships, and apprenticeships across the district. • Increase the number of articulated credits, community college credits, certifications, and credentials earned across the district. • Increase Technical Attainment • Increase Secondary Placement of our graduates • Increase the district’s graduation rate
Our Vision is Simple “Pathways to Prosperity” Charts the course for CTE
Harnett County Schools 2012-2013 Graduation Cohort Presentation to the Board of Education August 29, 2013 Sharon M. GaineyLEA Test Coordinator
The Who, When, and What about Harnett County Schools 2012-2013 Graduation Cohort Rate
What is Graduation Cohort? • Data Report required by the NCDPI to satisfy the NCLB (No Child Left Behind) Bill • 4-Year Cohort**** (students who finish all State requirements within four years) • 5-Year Cohort (students who finish all State requirements within five years) • A system that requires schools to track students progress through their senior year
Who is Included in the Cohort? • Students who were enrolled in the 8th grade for the first time in 2008 • Students who were enrolled in the 9th grade on the 20th day of school in 2009-2010 • Students who transferred in to our schools and were on track to graduate within four years • It is not based solely on the number of seniors who receive a diploma on graduation day/night
What is the Process to Complete the Graduation Report? • In late January, early February, the NCDPI sends (electronically) the LEA Test Coordinator a list of students who, according to their records, are a part of Harnett County Schools graduation cohort based on the data in their system • The information is shared with the school counselors and the search begins. If students on the list are not currently enrolled in school, we search for them in the following ways: • Counselor school records • Facebook • My Space • Spokeo • Judicial System • The NCDPI Search System
Which Students Count Against The LEA’s Graduation Cohort? • Students who dropped out of school • Students who transferred to a community college • Students enrolled in the OCS (Occupational Course of Study Program) they can remain in school until they are 22 • Students who will not graduate within the four year period-if they graduate in summer school or the next year, they count toward our five year cohort rate.
Where Does Harnett County Rate with the Graduation Cohort? The State requires an LEA to reach 80% OR increase their 4-year grad rate by 2% from the previous year • Harnett County increased the 4-year cohort graduation rate by 2.6% for 2012-2013 compared to 2011-2012! • Harnett County increased the 5-year cohort graduation rate by .5% for 2012-2013 compared to 2011-2012!
Where Does Harnett County Rate with the Graduation Cohort? (continued) • Triton High School led Harnett County with the highest 4-year graduation rate of 82% for 2012-2013! This was an increase of 5.9% from 2011-2012’s 76.1% rate! • Go Hawks! • Overhills High School led Harnett County with the largest 4-year graduation rate increase for 2012-2013! They increased 6.2% from 2011-2012’s 72.5% rate! • Go Jaguars!
Harnett County Schools 5-Year Cohort Rate • LEA-77.9% • HCHS-85.6% 5.2% Increase • OHS-77.3% 4.8% Increase • THS-78.2% • WHHS-81.1% • LEA-77.4% • HCHS-80.4% • OHS-72.5% • THS-82.1% • WHHS-81.3% 2012-2013 2011-2012
Which Students Don’t Count Against the LEA? Documentation is Required to Remove Students from the Data Report • Students who withdrew for homeschooling • Students who transferred to another public LEA in or out of state • Students who transferred to a private school • Students who are deceased • Students who transitioned to a correctional institution
Harnett County Schools 4-Year Graduation Cohort 2012-2013 2011-2012 Subgroup information is based on data collected when a student is last seen in the cohort.* Indicates that the student population in the subgroup is too small to report the value.The percentage is not shown if it is greater than 95 percent or less than 5 percent.
Harnett County Schools Areas of Focus 2012-2013 2011-2012 Subgroup information is based on data collected when a student is last seen in the cohort.* Indicates that the student population in the subgroup is too small to report the value.The percentage is not shown if it is greater than 95 percent or less than 5 percent.
Harnett County Schools Areas of Achievement! 2012-2013 2011-2012 Subgroup information is based on data collected when a student is last seen in the cohort.* Indicates that the student population in the subgroup is too small to report the value.The percentage is not shown if it is greater than 95 percent or less than 5 percent.
ACT Results • “North Carolina’s average ACT score fell in 2013. In past years when approximately 20 percent of North Carolina students selected to take the ACT, the state’s average score was higher than the national average. With a 100 percent participation rate, the state’s average composite score fell from 21.9 points (Class of 2012) to 18.7 points (Class of 2013). The national average composite score also fell from 21.1 in 2012 to 20.9 in 2013.” • Harnett County saw growth in ACT scores when we compare our 2012 11th grade students to our 2013 11th grade student results. • “Summary results from the recent assessments show that students in the Class of 2014 are likely to earn higher ACT scores than the Class of 2013.