Download
1 / 32
320 likes | 490 Views
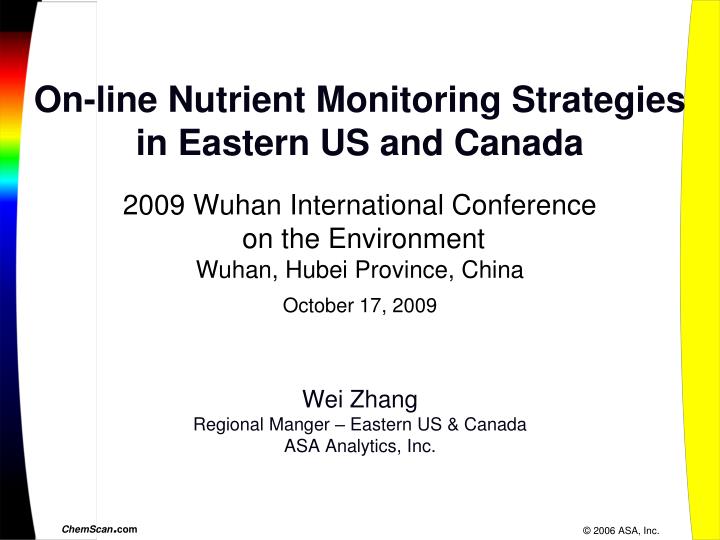
On-line Nutrient Monitoring Strategies in Eastern US and Canada 2009 Wuhan International Conference on the Environment Wuhan, Hubei Province, China October 17, 2009 Wei Zhang Regional Manger – Eastern US & Canada ASA Analytics, Inc. Outlines.

E N D
On-line Nutrient Monitoring Strategiesin Eastern US and Canada2009 Wuhan International Conference on the EnvironmentWuhan, Hubei Province, China October 17, 2009Wei ZhangRegional Manger – Eastern US & CanadaASA Analytics, Inc.
Outlines • Historical biological nutrient removal (BNR) overview in the region • Current municipal discharge regulations • Monitoring technologies • Application/Case Studies • Question & Answers
Historical Perspective • 1800’s wastewater treatment concept • 1900-1930: development of biological treatment • 1960: milestone – 50% of population covered. • 1972: Clean Water Act • Point source. NPDES discharge permitting program • Non-point source • Mid 1990 – current: nutrients focus • Great Lakes (treaty obligations) • Chesapeake Bay • Delaware River Basin
AppliedSpectrometry Associates, Inc.
Why On-line Nutrient Today? • Technology is more mature/proven • Tighter TN/TP discharge limits • Verify process performance • Operation cost saving: Chemical, Energy • If You Want to Control Process Chemistry, you need to Measure Process Chemistry
On-line Analyzer Category • In-Situ Type • Galvanic, polaorgraphic, luminescent type of “sensor” or “probe” immersed in the treatment process. • Most have single parameter • Central Type • Sample extracted from multiple process locations and analysis in a centralized flow through device in a analyzer • Allow multiple sample lines • Allow multiple parameters at each sample line
Comparison: Pros & Cons • Single locations vs. multiple locations • Single parameter vs. multiple parameters • Calibration issues • Cycle time issues
Polarography (pō'lərŏg'rəfē), in chemistry, method for analyzing the composition of a dilute electrolyte. Two electrodes are placed in the solution: One has a fixed potential (voltage) and is called the reference electrode, and the other has a variable potential and is called the polarizable electrode. As voltage is applied to the polarizable electrode, the resulting change in the current through the solution is monitored. By plotting the pairs of values for voltage and current, a series of current-voltage curves (polarograms) can be generated. The general name for this method is voltametry; the term polarography was formerly restricted to those cases where the polarizable electrode is a dropping mercury electrode, though now this distinction is often disregarded. Current-voltage curves, which look like a series of steps called polarographic waves, can be used to determine the reduction potentials of any reducible species present in the solution, e.g., inorganic ions or complex organic intermediates. Conversely, unknown substances can be identified by their characteristic reduction potentials. Quantitative titrations of an oxidizing agent by a reducing agent can be performed using a polarographic cell to determine the equivalence point by monitoring changes in the current.
AppliedSpectrometry Associates, Inc.
Methanol Denitrification Filter BOD Removal Nitrification Typical Application • Denitrification/phosphorus removal bio-filter • Chemical feed control scheme using nutrient parameter is well developed
A ENR Process Flow Diagram using DynaSand Continuous Backwash Filter
Final Clarifier Oxidation Ditch Primary Eff. AX RAS WAS BNR Process Schematic • Nitrification/Denitrification. No supplemental carbon • Similar to Modified Ludzack Ettinger (MLE) process • Some simultaneous nitrification/denitrification (SND)
Application in Advanced BNR • Advanced BNR Processes • Discharge limits on either total N or total P or both; • Treatment process involves more than one stand-alone BNR process • Advantages to use centralized analyzer • Confirming process performance between parallel treatment trains • Providing process profile for overall plant • Avoid possible calibration errors between individual sensors
Methanol Feed Primary Effluent Final Clarifier Aerobic Aerobic Aerobic Aerobic AX AX AX AX RAS WAS BNR Process Schematic • Step-feed BNR with supplemental carbon .
Anaerobic Methanol Denitrification Filter Final Clarifier AX Aerobic AX RAS Primary Sludge WAS BNR Process Schematic • Bardenpho Process with post denitrification filter • Two on-line nutrient analyzers
Back River WWTPCity of Baltimore, Maryland • Existing 180 mgd plant • MLE Process • Expect new discharge requirements • Evaluation of treatment alternatives • Modeling/Pilot testing
AppliedSpectrometry Associates, Inc.
AppliedSpectrometry Associates, Inc.
Case Study: Bonnybrook WWTP Calgary, Alberta Orthophosphate 4 Month Average Error 3.0 % Ammonia 4 Month Average Error 3.0 % AppliedSpectrometry Associates, Inc.
Case Study: Bonnybrook WWTP Calgary, Alberta Nitrate 4 Month Average Error 1.7 % TSS 4 Month Average Error 3.3 % AppliedSpectrometry Associates, Inc.
Summary • If you want to control process chemistry, measure process chemistry • Proven technology using nutrient parameter for process control/optimization • Advantages of multi-parameter multi-sample line analyzer system • Pay attention to Cost of Ownership • Pay attention to Maintenance Requirement