Download
1 / 26
260 likes | 457 Views
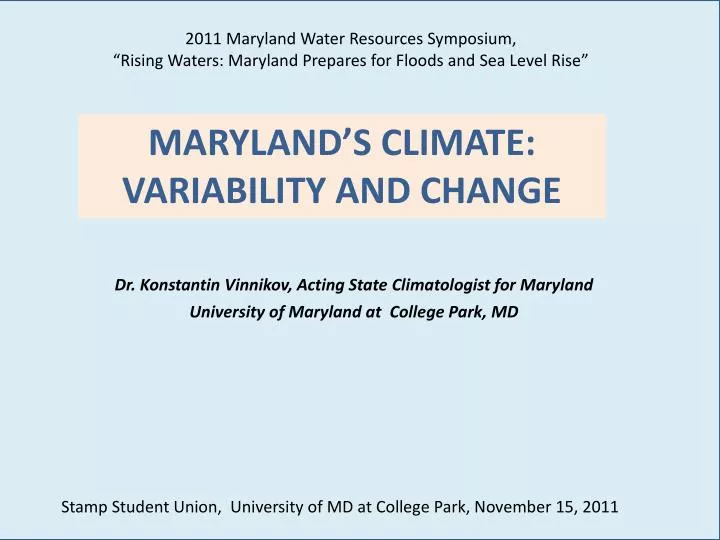
2011 Maryland Water Resources Symposium, “Rising Waters: Maryland Prepares for Floods and Sea Level Rise”. MARYLAND’S CLIMATE: VARIABILITY AND CHANGE. Dr. Konstantin Vinnikov, Acting State Climatologist for Maryland University of Maryland at College Park, MD.

E N D
2011 Maryland Water Resources Symposium, “Rising Waters: Maryland Prepares for Floods and Sea Level Rise” MARYLAND’S CLIMATE: VARIABILITY AND CHANGE Dr. Konstantin Vinnikov, Acting State Climatologist for Maryland University of Maryland at College Park, MD Stamp Student Union, University of MD at College Park, November 15, 2011
Maryland and Vicinity: Observed Daily Tmax & Tmin are Available for More than 95 yr. Stations Map
DATA SOURCES 1. NCDC: 1.1. USHCN Version 2, Adjustments by Menne and Williams (2010) 1.2. STATEWIDE AVERAGES OF TEMPERATURE AND PRECIPITATION, USHCN v2 data, AVERAGING by Vose (2010) 2. GFDL: 2.1. GFDL CM2.1 CLIMATE MODEL, 20C3M and SRESA1B FORCING, THREE ENSEMBLE RUNS (VARIABLES: TEMPERATURE AND PRECIPITATION) 3. USGS: 3.1. MONTHLY RIVERS DISCHARGE TIME SERIES GLOBAL WARMING SIGNATURE IN CLIMATIC RECORDS: . Warming trend (YES) . Polar amplification (YES in Arctic, NO in Antarctic) . Winter amplification (YES) . Diurnal asymmetry (?) . Increasing of precipitation (Seasonal) . Summer desiccation (?)
East Coast States: Observed Seasonal Variation of Mean Air Temperature and Trend
East Coast States: Observed Seasonal Variation of Mean Precipitation and Trend
East Coast Rivers: Observed Seasonal Variations of Runoff and Trend
Annual Cycle of Precipitation at MD and VA has MAX in the Summer and MIN in the Autumn. This makes our climate so nice.
The most important observed century scale climatic trends at Maryland and Virginia
How well climatic models simulate seasonal variation of atmospheric precipitation? OBSERVED MODEL SIMULATIONS
How well models reproduce observed 1895-2010 climatic trends in precipitation? Observed trends Trends in model simulated climate variations
How well models reproduce 1895-2010 precipitation variance and its trend? Observed variance and trend in variance Variance and variance trend in model simulated precipitation
How well climatic models simulate future MD climate change and variability? SUMMER SUMMER
How well climatic models simulate seasonal variation of Surface Air Temperature? Observed Model simulated
How well models reproduce observed 1895-2010 climatic trends in Temperature? Observed trends Trends in model simulated temperature variation
How well climatic models simulate future MD climate change and variability? SUMMER SUMMER
How well climatic models simulate future MD climate change and variability? WINTER WINTER
100 yr Averages (ºC) & Trends (ºC)/100 yr Mean Variances (ºC)2& Trends (ºC)2/100 yr • What we are looking for: • Asymmetry in trends of Tmax & Tmin. We expect that: Trend(Tmin)>Trend(Tmax). • 2. Trends in Variances. • What we see here: • 1. An Asymmetry does depend on station. • 2. All these three stations display a century scale decreasing trend in variances of Tmax. Trends in variances of Tmin are uncertain. Tmax Variances Tmin Trends Trends
100 yr Averages (ºC) & Trends (°C)/100 yr Mean Variances (ºC)2 & Trends (°C)2/100 yr 1. The expected asymmetry of trends in Tmax & Tmin at Laurel and Oakland. 2. There is century-scale warm seasons decreasing in variance of Tmax.
A century-scale warming trends can be clearly seen in observations of Tmax & Tminat 5 of 9 chosen meteorological stations at Maryland. • An expected asymmetry with Trend(Tmin)>Trend(Tmax) is found in observations of 3 of 9 chosen stations. Five other stations display an opposite Trend(Tmin)<Trend(Tmax). • Century-scale decreasing trends in variance of Tmax are found in observations at of 8 of 9 chosen meteorological stations.
CONCLUSIONS: • Mid-East Coast states enjoy beautiful climate with seasonal Maximum of precipitation in the Summer and Minimum - in the Autumn. • Global warming 1895-2010 has been accompanied by a decrease in Summer - and increase in Autumn precipitation in MD, VA, and other Mid-East Coast states. • These observed changes in precipitation are real and result in the observed Summer decrease and Autumn increase of river runoff. • GFDL/NOAA Climate Model global warming scenario simulations give us hope that the observed century scale Summer precipitation trend in MD & VA is going to change from a decreasing trend to an increasing trend. • We should not expect an increasing of MD climate variability.