Download
1 / 23
230 likes | 322 Views
Planning Issues and Agriculture. Lecture 4 Agriculture Land and the State Mapping Project. State mapping project. – designed to map California’s Land -- Used to determine 1 – how much Ag land is lost 2- what type of Ag land is being lost, quality of soil, access to water.

E N D
Planning Issues and Agriculture Lecture 4 Agriculture Land and the State Mapping Project
State mapping project • – designed to map California’s Land -- Used to determine 1 – how much Ag land is lost 2- what type of Ag land is being lost, quality of soil, access to water
Six categories of land: 1. Prime Farm land • most productive soil (highest quality) linked to higher yields and irrigation • precious commodity 2. Farmland of statewide importance • also irrigated land – • must have been irrigated within last 4 years • Soil of slightly lesser quality, minor shortcomings • Slope, salinity, etc. 3. Unique Farmland • irrigated or non-irrigated • Non-irrigated orchards or vineyards • soil less productive
Six categories of land continued: 4. Farmland of local importance • Importance to local economy • each county can determine or have power to designate • Board of Supervisors designates 5. Grazing land • livestock grazing • non-irrigated-poorest soil quality 6. Urban • built up land • was farmland and now is used for residential/commercial
As you recall… • CA. Valley is losing thousands of acres of prime farmland. • Same trend in Stanislaus County • Look at all the subdivisions • Commercial development • Retail • Patterns of growth pose a threat in the Central Valley. • Potential for urban/rural conflict • Controlled growth? • County must approve new cities, growth boundaries and annexations
Zone of conflict is urban edge… • For Example…N. Modesto- McHenry – • car dealer alley • ¼ community residential • ¼ transportation…roads • ¼ jurisdiction to point of sale…retail sales • ¼ Ag land now or ???
County Revenue • Revenue – County must share with cities • enables county to recapture revenue loss when annexation occurs • Control of land = control of $ • Property taxes go where?
County Ag land 1. Agriculture…Limited number of people or services – cost is low, .38 for every $ tax revenue 2. But cost is high for Ranchettes, more than revenue…$1.15 + Means county govt. has limited resources to serve populace living in county 3. Ag produces sales tax revenues -- a source of limited costs, but also limited tax revenues (food is non-taxable)
Why city growth? – • Retail trade • risk capital – will never be able to keep up with cost of service, (self funded)… so subsidized • But generates jobs, and… • Generate economic activity = growth, but • converts Ag land to development • County/City taking of land impacts Ag and Ag industry clusters
City Growth and Agriculture • Open space preservation – • Ag is not perceived as an industry • At first…ambivalence – • people don’t like congestion, crime • single family detached dwelling • are interested in quality of life and open space once the issue is recognized • Marin County for instance
Public Policy encourages urbanization and growth • Giving incentives for this type of growth • tax credits for business • low mortgages • low cost of living in valley (comparative) • Environment will suffer with growth --- • Air quality, water quality, open space, congestion … does reducing farmland exacerbate the problem or does it matter?
Survey of Central Valley Characteristics • Rapid growth • Quality of natural environment (detiorating ?) • Air, water, habitat • Gap between rich and poor … • Income • Home ownership • Careers and upward mobility • Job opportunities … (limited upper incomes) • Why?
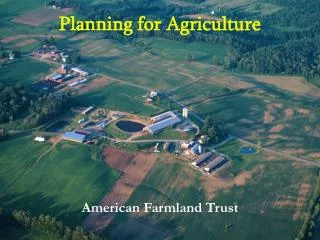
American Farmland Trust • AFT – thinks differently about growth – • we’re at a critical tipping point-(Read Article) • need a different type of urbanization and • more interest in public transportation
How do we know how much land is being lost ?Farmland Mapping • Assessment of farmland loss is for urban or other uses • 48% (half) of all state land is mapped • 98% of farmland is mapped • Have to break down – there are differences 1. Quality of soil for growing 2. Access to water (can land be irrigated?) 3. Topography (ex. Flat or sloped)
Prime Farmland • Best land is prime farmland • 50% of whole state 4.3 million acres is prime farmland – • Out of 8.5 to 9 million acres of total farmland • In San Joaquin Valley – 49% of this prime farmland is in our 8 counties. (2.1 mil)
Farmland catagories… 1- Prime farmland- 4.3 million 2- Farmland of statewide Importance – 2 million 3- Unique – 1 million ½ of all #1,2,3 land is in our SJ Valley 8 counties! Why?...Soil, Water, Climate
Water access for irrigation • Irrigation – best of best ( most useful ) • ? million irrigated acres in California how much and what % of the total is in the Valley ? Look this up…
How much land is being lost statewide? • 1992 – 1997…85,200 acres…Prime farmland • Increase from the previous 5 year period…15% • 500,000 acres of total farmland lost from 1988 to 1998 • Could lose a million more by 2040 • Conversion of prime farmland is 30% faster than non-prime farmland • AFT classifies the Central California Valley as the most threatened farmland in the country
How much land is being lost statewide?...continued • Urbanization could consume or indirectly affect over 3.6 million acres of irrigated land, more than half of the 6.7 million irrigated acres in the 11 counties that comprise the Central Valley floor (AFT survey) • Land converted to urban uses was 87,000 acres over a two year period 96-98. • 22% of all land converted to urbanization is prime farmland
Regional Picture Regionally – 10-11% of all prime farmland lost to urbanization in Valley Converted to urban use! (1996-98) Point is: Land is being developed at ever increasing rates---significant % of prime farmland is being destroyed
Interest statewide to protect prime farmland.. What are the options? • 1. Use regulatory powers of gov. (police power) to conserve land available (Green belts, environmental sensitive areas, Ag buffer zones) • 2. Use of special regional agencies that have control over boundaries of communities to protect farmland (Planning Commission). • 3. Use tax incentives for landowners and local govs. to conserve local land (Williamson Act)
More options? • 4. Use of innovative non-government tools to preserve land (transfer of developers rights/purchase of conservation easements). • Farmland Trust • 5. Linking of ag conservation to local economic development clusters… promotes better economic value (business)
Even more options? • 6. develop new ways of planning urban areas – smart growth into less “prime” land (General Plan) • 7. Sustain environment, encourage greater public involvement…(initiatives on the ballot, Ag buffer zones, Green belts) • best prime farmland is on boundaries of cities. • It lands on the edge - “zone of conflict” • keeps pushing the line (who?)