Download
1 / 19
190 likes | 339 Views
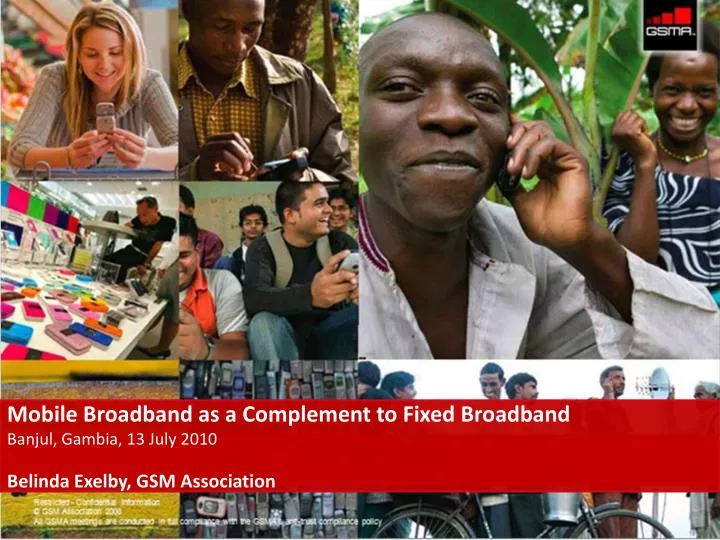
Mobile Broadband as a Complement to Fixed Broadband Banjul, Gambia, 13 July 2010 Belinda Exelby, GSM Association. Mobile Complements Fixed for Broadband. Mobile. Fixed Broadband. 1.3 Billion Lines 19.4% of the world’s population. 4.8 Billion Connections 72.7% of the world’s population.

E N D
Mobile Broadband as a Complement to Fixed Broadband Banjul, Gambia, 13 July 2010 Belinda Exelby, GSM Association
Mobile Complements Fixed for Broadband Mobile Fixed Broadband 1.3 Billion Lines 19.4% of the world’s population 4.8 Billion Connections 72.7% of the world’s population
The Lessons of History (Fixed) Source: Wireless Intelligence & ITU • Comparing the slow growth in fixed broadband with the rapid pace of mobile adoption suggests that much of the future growth of broadband delivery will be over the mobile network.
The Changing Face of Mobile • Consistent evolution of global standards provides economies of scale which drive down costs for consumers 1990 1991 1992 1993 1994 1995 1996 1997 1998 1999 2000 2001 2002 2003 2004 2005 2006 2007 2008 2009 2010 2011 2012 2013 2014 2015 LTE 100Mbps HSPA+ 28-42Mbps HSPA 14.4Mbps WCDMA 384kbps HSPA GSM 9.6kbps 3G WCDMA 2G GSM Source: Wireless Intelligence, January, 2009
HSPA Subscribers Today US & Canada – 47.3M Western Europe – 75.6M Eastern Europe – 12.8M Middle East – 9.3M Total HSPA Subs 237.7 million Americas – 10.5M Africa – 4.3M Asia Pac – 77.9M Source: Wireless Intelligence, Q1 2010 • HSPA/HSPA+ will dominate wireless broadband services, with 1.1 billion customers worldwide by 2015
HSPA Launch Dates and Subscribers in Africa Morocco HSPA Lunch: Q2 2007 HSPA Subs: 520,107 Egypt HSPA Lunch: Q2 2006 HSPA Subs: 819,774 Libya HSPA Lunch: Q1 2007 HSPA Subs: 811,983 Uganda HSPA Lunch: Q4 2007 HSPA Subs: 61,561 Ghana HSPA Lunch: Q4 2008 HSPA Subs: 78,957 Kenya HSPA Lunch: Q2 2008 HSPA Subs: 31,218 Nigeria HSPA Lunch: Q1 2008 HSPA Subs: 450,454 Tanzania HSPA Lunch: Q2 2007 HSPA Subs: 112,997 Namibia HSPA Lunch: Q4 2006 HSPA Subs: 37,832 Mozambique HSPA Lunch: Q4 2008 HSPA Subs: 122,075 South Africa HSPA Lunch: Q2 2006 HSPA Subs: 1,289,510 Madagascar HSPA Lunch: Q4 2009 HSPA Subs: 5,411 Botswana HSPA Lunch: Q3 2008 HSPA Subs: 10,964
In Africa Mobile drives Broadband Penetration • In 2007, mobile broadband represented 24% of fixed broadband connections in Africa • By the end of 2009 this figure had climbed to almost 75%
Mobile Broadband - overtaking Fixed Source: Wireless Intelligence & Telegeography • Where there is a choice of broadband access technology in Africa, consumers are using mobile more than fixed
Infrastructure Challenges FIXED MOBILE • Limited existing infrastructure • High operating expenses • Further roll-out cumbersome and expensive • Rapid, relatively low-cost roll-out • Easily scalable • More spectrum becoming available • Mobile is critical for universal broadband coverage
Broadband Drives GDP Growth • World Bank analysis of 120 countries estimated that for every 10% increase in the penetration of broadband services, there is an increase in economic growth of 1.3%* • Booz & Co research found that: • Countries with 80% broadband penetration are more than twice as innovative as countries with 40% penetration • Increasing broadband penetration by 10% translates into a 1.5% increase in a country’s labour productivity † Sources: *World Bank, Qiang 2009; † Booz & Company, Enabling Sustainable Digital Highways; Strategies for Next-Generation Broadband
Immediate value creation 2 5 3 1 4 Multiplier effects Foreign direct investments Human capital formation Productivity increases How Broadband Stimulates Economic Growth Explanation Examples GDP contribution from direct investments in network Direct (ICT industry) Impact of broadband investment on suppliers of equipment, content, etc. Foreign direct investments as a result of good ICT infrastructure Indirect (other industries) More efficient business processes because of connectivity Increase in knowledge and skills as well as improved services through broadband Source: McKinsey 12
Spectrum availability 1 Infrastructure/ spectrum sharing 2 Coverage obligations 3 Industry structure 4 Spectrum/ licence pricing 5 Policy-making to Facilitate Mobile Broadband Impact on cost to serve per subscriber* POTENTIAL ACTIONS FOR POLICY MAKERS • Make low-band spectrum available to reduce access network cost • Ensure allocation of sufficient contiguous spectrum (10–12 MHz) • Monitor and manage usage to optimize allocation • Guarantee neutrality of technology to ensure innovation -40–50 • Promote infrastructure sharing (tower/backhaul) to reduce network cost • Allow spectrum sharing/national data roaming to increase efficiency and reduce operational costs -35–40 • Provide incentives for roll out (e.g., regulatory concessions) • Encourage public-private partnerships or grant separate licenses for rural areas to drive coverage • Provide public funding for remote areas to achieve sufficient coverage -25–35 • Ensure an economically viable number of players in the market • Allow industry consolidation if not market-distorting -20–30 • Charge nominal spectrum/licence fees to ensure affordability • Award licences based on coverage, partially substituting or replacing financial criteria -15–30*** Total impact of up to 75% reduction in cost to serve Source: McKinsey
Spectrum is Needed for Broadband to Grow 1987-2010 450-600 MHz in each market X3 Aggregated Band Width 2010-2020 1.3GHz-1.7GHz in each market Regulators are allocating more bandwidth and eliminating or redefining spectrum caps as they realise broadband requires more spectrum • According to ITU, by the year 2020 mobile services will need: • 1.280 GHz for low market demand (rural areas) • 1.720 GHz for high market demand (urban areas) Source: ITU-R Report M.2078
Economic Impact of Taxation Impactof Taxation on the Development of the Mobile Broadband Sector in Emerging Countries, GSMA, July 2010
Taxation Structure Impacts Mobile Penetration Estimated percentage increase in mobile penetration resulting from changes in taxation Estimated percentage increase in mobile user base resulting from changes in taxation • Reduction of 1% of tax on TCO • Reduction of tax to benchmark rate (6.1%) • Reduction of 1% of tax on TCO • Reduction of tax to benchmark rate (6.1%) Note: Malaysia is considered to be the benchmark at 6.1% Source: Impactof Taxation on the Development of the Mobile Broadband Sector in Emerging Countries, GSMA, July 2010
Conclusions • Mobile broadband is a vital complement to fixed • Internet connectivity via mobile broadband will • dramatically enhance people’s lives and prospects • provide a huge boost to national economies • Spectrum and taxation policies will affect the pace at which mobile broadband networks can be rolled out
THANK YOU For more information: www.gsmworld.com