Download
1 / 22
230 likes | 394 Views
Digital Receiver with Interference Suppression for Microwave Radiometry. NASA Instrument Incubator Program Annual Review Joel T. Johnson, Steven W. Ellingson, and Grant A. Hampson. Instrument Incubator Program. ESTO Earth Science Technology Office.

E N D
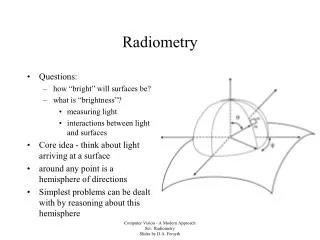
Digital Receiver with Interference Suppression for Microwave Radiometry NASA Instrument Incubator Program Annual Review Joel T. Johnson, Steven W. Ellingson, and Grant A. Hampson
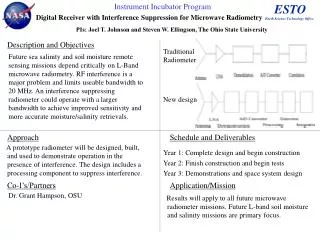
Instrument Incubator Program ESTO Earth Science Technology Office Antenna LNA Downconv. ADC Corr/Integrate (optional) Digital Receiver with Interference Suppression for Microwave Radiometry PIs: Joel T. Johnson and Steven W. Ellingson, The Ohio State University Description and Objectives Traditional Radiometer Future sea salinity and soil moisture remote sensing missions depend critically on L-Band microwave radiometry. RF interference is a major problem and limits useable bandwidth to 20 MHz. An interference suppressing radiometer could operate with a larger bandwidth to achieve improved sensitivity and more accurate moisture/salinity retrievals. New design LNA ADC Corr/Integrate Antenna Downconv. RFI Processor Approach Schedule and Deliverables A prototype radiometer will be designed, built, and used to demonstrate operation in the presence of interference. The design includes a processing component to suppress interference. Year 1: Complete design and begin construction Year 2: Finish construction and begin tests Year 3: Demonstrations and space system design Co-I’s/Partners Application/Mission Dr. Grant Hampson, OSU TRL levels: from 3 to 5/6 Results will apply to all future microwave radiometer missions. Future L-band soil moisture and salinity missions are primary focus.
Project Schedule • Project “year 1” is 9 months, 3/11/02-11/30/02; interim review held at 4.5 months
Progress in Year One • Milestone 1: “Complete Instrument Design and Order Parts” • System block diagram and designs of components complete • Analog Front End • Analog Downconverter • Digital Back-End • Interference Suppression Processor • Milestone 2: “Progress in Breadboard Instrument Design and Algorithm Development” • Several components currently in initial implementation • Analog downconverter, A/D, Digital IF, Asynchronous Pulse Blanker (APB), FFT, Spectral Domain Processor (SDP) • APB design specifies basic adaptive excision algorithm • Addition: Developed LISA system for airborne RFI survey with GSFC • Current TRL Status: In transition from TRL 3 to TRL 4
System Block Diagram Low-noise front end Analog Downconverter Digital Downconverter Antenna ADC Asynchronous Pulse Blanker 1024 point FFT Frequency domain blanker Integration Data Recording/ Control
Budget/Personnel • Budget for year 1: 239.5K + 21K equipment • Remaining as of 9/30: ~31.5K + 0K equipment (15.7K/month in 2 mo) • No cost under- or over-runs are expected • Tentative budgets for years 2/3: 294.4K/288.9K • Personnel: • J. T. Johnson, S. W. Ellingson: co-PIs • G. A. Hampson: Research Scientist • D. R. Wiggins: Graduate student (graduated June 02) • Currently screening graduate student candidates • Document Server (password protected): http://esl.eng.ohio-state.edu/~swe/iip/docserv.html • Annual report to be delivered by Dec 10 2003
Plans for 12/1/02-11/30/03 • 12/1/02-5/31/03: “Progress in Breadboard Instrument Design and Algorithm Development” • Complete implementation of front end, full FFT processor, and post-FFT processing stages • Refine combined time domain and post-FFT processing algorithms • Test/refine algorithms with data from LISA measurements • Interim review (teleconference?): late May to early June 2003 • 6/1/03-11/30/03: “Complete Breadboard Instrument Fabrication; Progress in Laboratory Tests” • Test complete system; study accuracy and stability (TRL 4) • Begin outdoor tests at ESL: calibrated observations of a large water pool (TRL 5-6) • Refine algorithms as necessary in tests; document performance • Annual review (ESL or GSFC?): early October 2003
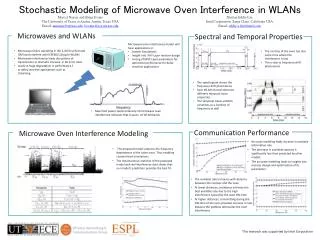
Initial Results: RFI survey from ESL roof • Spectrum analyzer measurement with • low gain antenna on ESL roof • interim low-noise front end • Strong interferer at 1331 MHz 1326-1336 MHz, RBW 10 kHz 1325-1425 MHz, RBW 100 kHz Some frequency spread apparent Quiet band
Initial Results: RFI Measurement in Time Domain • Time domain (“zero span”) spectrum analyzer measurements from ESL roof with low-gain antenna: 1331 MHz +/- 1.5 MHz • ATC radar in London, OH (43 km away): PRF 350 Hz, 2 usec pulses plus multipath, approximate 10 sec rotational period
Initial Results: Time Blanking of ATC Radar • Initial tests with available front end and low gain antenna on ESL roof • 1306 +/- 50 MHz including digital IF, APB, FFT, and integration • Spectra integrated over 42 ms Without APB on Rotation rate of ATC radar at 1331 MHz clearly visible With APB on APB effectively removes radar RFI
Initial Results: Time Blanking of ATC Radar • Time domain results: • Effect of varying APB threshold in frequency domain: Direct path Multi-path? APB “Blanking” decision “Max held” spectra Averaged spectra
Initial Results: System Dynamic Range and Stability • Single tone injected into system front end: 50 dB dynamic range visible • Stability test with terminated antenna port Nominal max is 54 dB from ADC +30 dB from FFT - 6 dB margin Follows ideal behavior up to millions of FFTs: further tests planned with complete system front end
Radiometer Front End/Downconverter • Relatively standard super-het design: expected Tsys approx. 400K • 100 MHz split into two back-end channels due to ADC limits • Stability: analog gain reduced by high dynamic range ADC, low order analog filters, internal cal loads • Temperature sensing of terminator, thermal control requirements to be determined • Final implementation awaiting integration with system antenna
Analog Downconverter: Current Implementation • Near identical to final design without power divider, var. attenuator, and analog blanking switch
ADC DIF APB FFT SDP Digital Back-End • System design includes digital IF downconverter (DIF), asynchronous pulse blanker (APB), FFT stage, and SDP operations • Each block currently implemented on separate boards to simplify testing and reconfiguration • Microcontroller interface via ethernet for setting on-chip parameters • Using Altera FPGA’s: order of 4000 LE, $150 (full data rate FFT block will require 2 larger FPGA’s with order of 12000 LE, $512 each) • Designs for all components complete; DIF, APB, FFT, SDP, and capture card initial implementations functioning Analog Devices 9410 200 MSPS 100 MSPS I/Q
Current Digital Back-End Implementation • Modular form used for processor boards: note microcontrollers • Altera’s Quartus software used for FPGA synthesis, fitting, and simulation (AHDL) • Altera FIR and FFT Megacores • Four layer circuit board layout • LabWindows CVI software with PCI-DIO-32HS digital I/O card ADC DIF APB FFT Capture SDP
Interference Suppression Algorithms • APB updates mean/variance of incoming time domain signal; a sample > b standard deviations above the mean triggers blanker • Blanking operates on down-stream data exiting a FIFO; blank signals before and after blanking trigger • Parameters: blanking window size, precursor length, threshhold • With multiple “blanking timing registers” (BTRs), additional “pulses” occurring during blanking window can trigger more blanking events • Post-FFT: two methods • similar to APB, monitor per-bin mean/variance in time and blank outliers • unlike APB, can also blank outliers in freq. response at single time • window lengths and thresholds to be quantified in future work • Parametric: remove interferer based on parametric fit to a specific functional form; to be explored further in future work • Calibration effects corrected in real-time by appropriate scale factors
Digital Downconverter • Fs/4 down-conversion, digital filtering to 50 MHz, Fs/4 down/up conversion for simplicity in implementation • Measurement of digital filter response:
Asynchronous Pulse Blanker • Fully parallel digital processing system for implementing APB: • Detection operates at 1/4 system clock rate due to precision requirements: still sufficient to capture pulses given pre-cursor blanking • Initial implementation with one BTR
FFT FFT’s programmed using Altera FFT libraries, includes windowing 1024 points chosen as trade off of complexity and bin size Computation of FFT introduces delay; insufficient speed for all data at 100 MHz Propose 8 FFT blocks on 2 FPGA’s to retain 100 MSPS Currently implemented only a single FFT block (14% throughput)
LISA • Measurements of RFI at multiple locations and from airborne platforms needed to develop robust interference suppression algorithms • L-band interference surveyor/analyzer (LISA) developed for inclusion in NASA P-3 flights; first tests to occur with AESMIR • Spectrum analyzer for wideband survey + custom 16 MHz digitizer • Data useful for IIP project and for NASA researchers
Experiment Planning • A series of experiments with the prototype will be conducted at ESL in years two and three for verification • Observations of a large water tank planned; external cal sources are ambient absorbers and a sky reflector • For operation in far field, spot size on ground proportional to antenna size; choose antenna diameter 1.2 m as a compromise between angular resolution and spot size • Antenna provides ~15 deg beamwidth; operation from ESL roof yields antenna height ~10 m • Resulting 3 dB spot size is ~ 6 m x 3 m for 55 deg operation; water tank should be approx. 20’ x 10’ • Cal targets will be of identical size to reduce effect of background contributions; time series of observations will be correlated with target temperatures • Selection of parts (antenna, feed, antenna mount, temperature recording equipment, cal loads) currently in progress