Download
1 / 41
410 likes | 509 Views
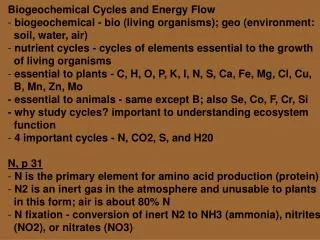
Ecosystem Ecology I. Introduction II. Energy Flow III. Biogeochemical Cycles. III. BIOGEOCHEMICAL CYCLES A. Overview. Small reservoir. “Turns fast”. FLUX. “Turns slow” Large reservoir. B. The Water Cycle. B. The Water Cycle. All values in teratons (x 10 18 g). Atmosphere (13)

E N D
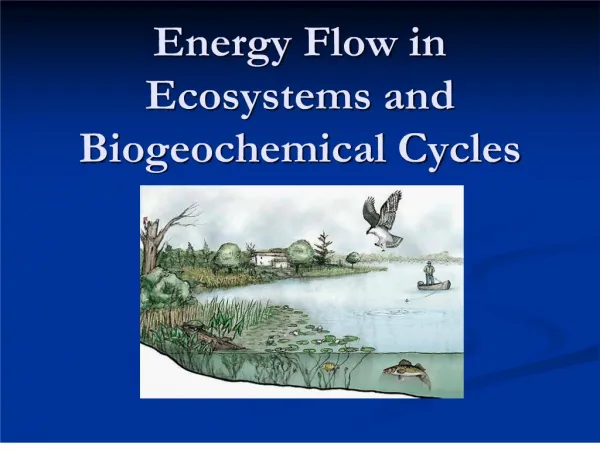
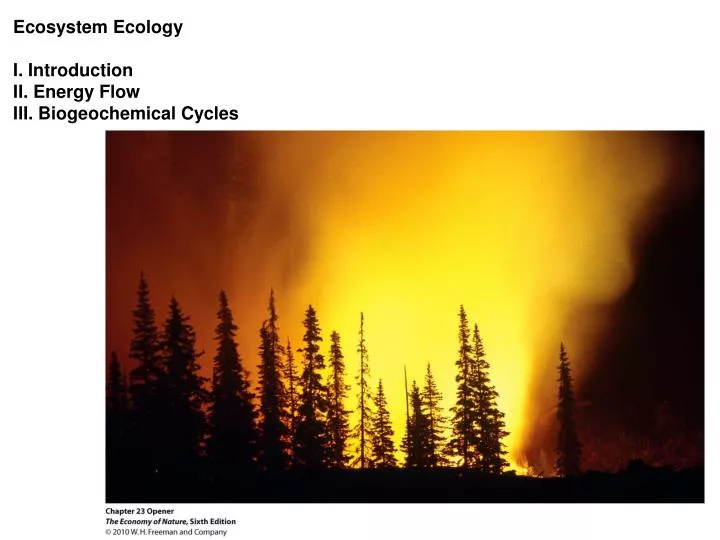
Ecosystem Ecology I. Introduction II. Energy Flow III. Biogeochemical Cycles
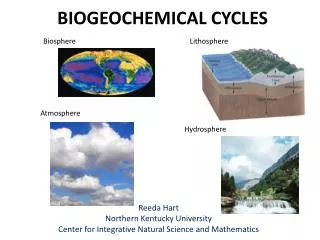
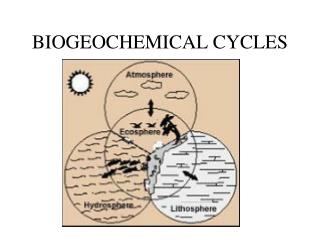
III. BIOGEOCHEMICAL CYCLES A. Overview Small reservoir “Turns fast” FLUX “Turns slow” Large reservoir
B. The Water Cycle All values in teratons (x 1018 g) Atmosphere (13) OVER OCEAN OVER LAND Rain Evaporation Rain Evaporation (385) (425) (111) (71) Oceans - 97% Runoff and Groundwater (40) (1,380,000)Lakes and Rivers (100) Water content in sedimentary rock near surface (210,000) Biosphere (1)
B. The Water Cycle - Effects of Life 1. Plant biomass pumps water out of the soil into the atmosphere, increasing evaporation rates. 2. Volatiles act as nuclei on which raindrops can form ("Smoky Mountains"), increasing local precipitation. Large forests stimulate the rainfall they depend on.
-Effects of Life: • Cut forest – reduce evapotranspiration, increase runoff and river discharge • Eventually, reduce precipitation, and reduce river discharge.
B. The Water Cycle - Effects of Humans
B. The Water Cycle • Effects of Humans • 1. Control 50% of surface runoff of planet • - 70% agriculture • - 20% industry • - 10% personal use
Most population growth is in tropical/arid areas where more water is needed to grow the same amount of crop, because PET > Precipitation
98% of water ‘footprint’ for animals is for their feed. 30% of all water used for animals is for beef cattle Another 20% for dairy cattle
B. The Water Cycle • Effects of Humans • 1. Control 50% of surface runoff of planet • - 70% agriculture • - 20% industry • - 10% personal use • 2. Dams
2. Dams – Three Gorges, Yangtze River Ship locks
2. Dams – Three Gorges, Yangtzee River 1.5 miles wide, 600 feet high Largest dam in the world – largest engineering project in the world.
1.5 miles wide, 600 feet high Reservoir 570 feet deep and nearly 400 miles long.
Energy = 18 nuke plants. At full power, reduces coal consumption by 31 million tonnes per year, avoiding 100 million tonnes of greenhouse gas emissions 100
Regulate a deadly, flood-prone river: The 1998 flood (before the dam): 3,704 dead, 15 million homeless and $26 billion in economic loss. A staggering 25 million acres (~Kentucky) were evacuated, 13.3 million houses were damaged or destroyed.
Displaced 1.2 million people Cover 1300 important archeological sites
2. Dams – Problems: - Flood upstream habitats - release toxins into water - cause eutrophication - reduce oxygen content of water - sediment buildup decreases “head” and power generation - sediment trap starves downstream of sediment and nutrients – erosion of river delta and loss of productive estuary - reduce fisheries productivity “The construction of dams is increasingly regarded as the biggest conservation threat to aquatic and riparian biodiversity in many river basins throughout the world.” J. Wu, J. Huang, and X. Han. 2003. Science 302:11-49-1150.
B. The Water Cycle • Effects of Humans • 1. Control 50% of surface runoff of planet • - 70% agriculture • - 20% industry • - 10% personal use • 2. Dams • 3. Overtapped Rivers • Major rivers like the Colorado, Nile, Ganges, Yellow • don’t reach the ocean for months at a time – all the • water is drawn off by humans upstream.
Glen Canyon – 710 ft Hoover – 726 ft tall
Cohen, et al (2001). A preliminary water balance for the Colorado River Delta, 1992-1998. J. Arid Environments 49:35-48. Hoover Dam Glen Canyon Dam
3. Overtapped Rivers Yellow River (China): Days Dry at Mouth: 1995: 122 1996: 133 1997: 226 (7 months!)
3. Overtapped Rivers The Aral Sea, Kazakhstan: once the 4th largest inland sea in world Has lost 60% of its water, drawn off for agricultural purposes. - Salinization increased, killing the productive fisheries industry - Agriculture – salt increased 6X by 1994 the productivity had dropped by 20-50%.
3. Overtapped Rivers The Aral Sea, Kazakhstan: - salt and dust in air became a significant health problem April 2003
3. Overtapped Rivers The Ganges and Indus: • Water is diverted for agriculture. • Salt water intrudes mangrove estuaries • Kills mangroves • Nursery areas for fish • Storm breaks and flood regulators.
3. Overtapped Rivers Other Problems of "overtapping" rivers... 1. Reduced water availability 2. Salinized soils (20% worldwide) 3. Regional Conflicts - “water rights” issues cross state and national boundaries
3. Regional Conflicts - Egypt: gets 97% of its water from outside its borders… water treaties with the Sudan are the oldest on record. - Ethiopia, with headwaters of the Blue Nile, wants to construct dams for hydroelectric power. Egypt and Sudan have battled them for decades. “The only matter that could take Egypt to war again is water” – Anwar Sadat, 1979
3. Regional Conflicts - The Jordan River (Jordan and Israel) - The Indus (India and Pakistan) - The Ganges (India and Bangladesh) - The Colorado: Colorado, Utah, Arizona, Nevada, California
1. Control 50% of surface water 2. Dams 3. Overtapped Rivers 4. Overtapped groundwater - In Punjab (Indus Valley): Wealthy can dig deeper wells, lowering water table, making it inaccessible for shallow wells.
1. Control 50% of surface water 2. Dams 3. Overtapped Rivers 4. Overtapped groundwater - In Punjab (Indus Valley): pumping from wells exceeds recharge by 27%. Water table falling 0.7 m/yr Wealthy can dig deeper wells, lowering water table, making it inaccessible for shallow wells.
- The Ogallala Aquifer: Under 174,000 square miles and 8 agricultural states. 95% of pumped water is for irrigation PUMPING: 1949: 4 million acre-feet/yr 1980: 18 million acre-ft/yr 2000: 3-4 mill. a-ft/yr
- The Ogallala Aquifer: Under 225,000 square miles and 8 agricultural states. 95% of pumped water is for irrigation WATER LEVEL: 1950: dropped 5 ft/yr 1990’s: 1.35 ft/yr Decline in well yields correlates with 20-50% decline in productivity in Texas High Plains (dry)
- The Ogallala Aquifer: Lubbock, Texas: 18 inches of rain 80 inches of evaporative potential Irrigation has to make up that difference AND water the plants!!
- The Ogallala Aquifer: What’s left? 3.27 billion acre-feet (WOW!) It is 1000 feet deep in some areas of Nebraska (U.S. – 2.3 billion acres) Is it inexhaustible?
- The Ogallala Aquifer: Is it inexhaustible? That depends on where you are… when saturation depth drops to 30 feet, can’t sustain high volume pumping for agriculture (1000 gallons/min) Dropping 1 ft/yr…
So, to produce food we spread the water in rivers over our agricultural land. This produces food, but also increases evaporation of that water. We are also ‘mining’ water from the ground, increasing it’s transfer. So humans are increasing flux rates… and eventually, through these exchanges, the water ends up in the ocean where it resides for a long time.