Download
1 / 36
360 likes | 496 Views
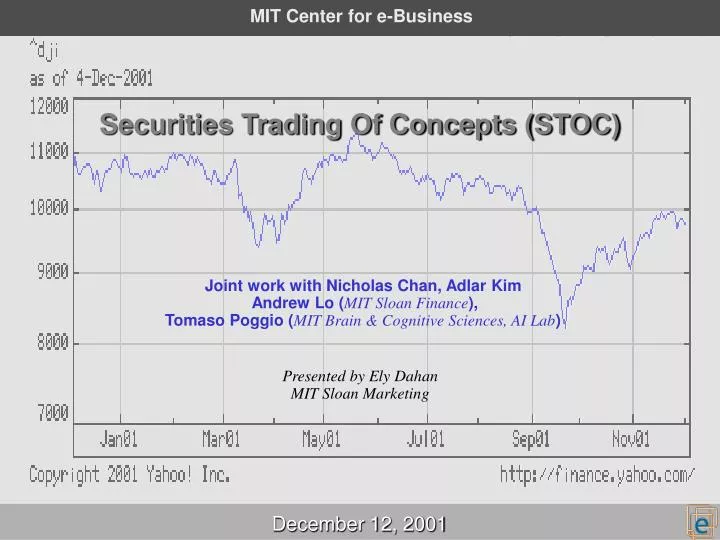
Joint work with Nicholas Chan, Adlar Kim Andrew Lo ( MIT Sloan Finance ), Tomaso Poggio ( MIT Brain & Cognitive Sciences, AI Lab ). MIT Center for e-Business. Securities Trading Of Concepts (STOC). Presented by Ely Dahan MIT Sloan Marketing. December 12, 2001.

E N D
Joint work with Nicholas Chan, Adlar Kim Andrew Lo (MIT Sloan Finance),Tomaso Poggio (MIT Brain & Cognitive Sciences, AI Lab) MIT Center for e-Business Securities Trading Of Concepts (STOC) Presented by Ely DahanMIT Sloan Marketing December 12, 2001
Why Test? A stochastic view of NPD New testing tools – The Virtual Customer Initiative STOC – A novel market research method Internal validation External validation Agenda – Predicting New Product Success
How does STOC function in real settings? How accurate is STOC? What does STOC actually measure? How do STOC traders decide when to buy and sell? For what product/service categories is STOC effective? Does STOC work for Product Concepts? Attributes? Research Questions Web-based interface with media-rich product information Good internal and external validity Individual preferences AND group preferences Personal preference, expectations of group preference, learning Seems broad: movies, candidates, bike pumps, cars, laptop bags Yes for both, but varies from case to case
Parallel & Sequential search:Weitzman(‘79)Srinivasan, Lovejoy, Beach (‘97)Dahan and Mendelson (’01)Morgan & Manning(‘85) R&D Options:Hauser & Zettelmeyer (‘97)Baldwin and Clark (‘00) Organizing Design:Wheelwright & Clark (‘92)DesChamps & Nayak (‘95)Leonard-Barton (‘95)Dahan and Hauser (’02) Web-Based Market Research:Willkie, Adams & Girnius (’99)Dahan and Srinivasan (’00)Dahan and Hauser (’02)Prelec (’02) Simulated Securities Markets:Plott and Sunder (’82, ’88)Hanson (’95, ’99)Forsythe, et. al. (‘’90, ’92) Literature
Resolving Uncertainty in NPD: What Type of Test? STOC VOC, Conjoint Concept Test DFMA Prototypes Test Market MarketingAttributes/Levels Price Sensitivity Brand Preference DesignAesthetics Architecture Design Manufacturing Number of Parts Mfg. ProcessModularity Cost Price Brand Aesthetics Design Parts ProcessUnit Cost Price Design ProcessUnit Cost Price Mix Total Cost Revenues Profits Design & Engineer Concepts Testing Launch Ideation
The Three Extreme Value Distributions New products are the best (most profitable) of many potential ideas
Spending on Concept Tests Spending on NPD testing depends on shape of upside profit uncertainty
Impact of the WEB on Market Research MediaRich STOC VirtualCustomerResearch Conceptualization Adaptive Computation Verbal FixedDesign TraditionalMarketResearch Communication Slow Fast
STOC fits the Virtual Customer Initiative Fixed Experiment Adaptive Experiment Attributes Full concepts Ely DahanRob HardyLimor Weisberg Ely Dahan John R. Hauser Duncan Simester Olivier Toubia Ely DahanRob HardyLimor Weisberg N. Chan, Adlar Kim,Ely Dahan, Andrew Lo,Tomaso Poggio Ely DahanV. Seenu SrinivasanLeonard Lee CIPD CeB
Are Web Respondents Representative? • Game Markets • Iowa Electronics Markets (http://www.biz.uiowa.edu/IEM) • Foresight Exchange (http://www.ideosphere.com/FX) • Hollywood Stock Exchange (http://www.HSX.com)
Multiple Experiments for multiple products Conjoint Features Virtual Concepts STOC Concepts User Design RankedChoices STOC Attributes Actual Purchases 5 - - - - (4) 7 - (4) 10 (3) (2) Product Category Bicycle Pumps Crossover Vehicles Laptop Bags Sources of data for internal and external validation
User Design (UD) Individual attribute choices lead to an ideal bundle
Web-based Conjoint Analysis (WCA) Bundles of attributes to measure tradeoffs
User Design as Conjoint Validation Attribute-by-Attribute “Hit Rates” CEB 1/16/01 and MBA’s 3/20/01 (n=130)
Virtual Concept Test (VCT) Dahan and Srinivasan, JPIM 2000 ABCD: Attributes + Brand + Cost + Design
Gorevs.Bush Share of Vote Probability of Winning Source: Iowa Electronics Market (IEM), 11/7/00 at 2pm
Hooray for Hollywood Source: HSX.com, December 7, 2001
Bragging rights to predicting the future … Source: http://www.ideosphere.com/fx, December 10, 2001
Current game markets share some traits FX HSX IEM • All three predict actual future outcomes • Underlying reasons are not made explicit
STOC Outcomes vs. Virtual Concept Testing Median Stock Prices r2 = 0.79 Physical, 0.87 Web r2 = 0.64 Physical, 0.76 Web
Choice Out of a Set of Eight (Rank order) $24,000 $36,000 $49,000 $39,000 $37,000 $42,000 $29,000 $30,000
Securities trading of Concepts (STOC) Students valued BMW and Mercedes STOC highly,even though they “bought”them less frequently r2 = 0.60 r2 = 0.63
Securities trading of Concepts (STOC) r2 = 0.87
Securities trading of Concepts (STOC) r2 = 0.80
Three STOC Games for Laptop Bags Actual Choice(n=330) 14% 10% 32% 23% 6% 5% 2% 8% Five STOC Metrics Prediction was very bad in all three case - almost pure noise
Securities Trading Of Attributes (STOA) Red Handle PDA Cell Logo Flap Mesh Boot Large Will prediction improve if traders consider each attribute independently?
Prior Individual Estimates of Attributes 330 ActualChoices 61% 25% 71% 83% 25% 34% 58% 59% 75% 109 SurveyResponses 54% (±19%) 22% (±20%) 66% (±22%) 68% (±19%) 26% (±16%) 33% (±18%) 51% (±22%) 43% (±22%) 49% (±22%) What % of 330 first year Sloanies (in 2000) bought each of the nine upgrades?
Securities Trading Of Attributes (STOA) Large Red Logo Handle PDA Cell Mesh Flap Boot Did prediction improve if traders consider each attribute independently? YES!
How do individual traders rank? (laptop bag attributes) InaccurateWinners AccurateLoser Accurate Winners High market-priced portfolios don’t always identify “accurate” traders
Order Effect: Bottom stocks get traded less, at lower prices October 15, 2001, 1pm (n=52) This suggests a need to have stocks randomly ordered by trader
Order Effect: Bottom stocks get traded less, at lower prices October 15, 2001, 10am (n=57) This suggests a need to have stocks randomly ordered by trader
Conclusions about STOC • Functions well with informed traders • Is accurate at identifying winners • Measures preferences in the aggregate • Traders behave heterogeneously, learn • Predicts well for many product categories • Can be effective with concepts AND attributes • Real outcomes are not absolutely necessary