Download
1 / 48
500 likes | 882 Views
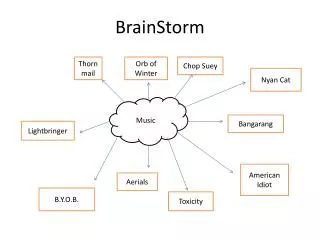
Brainstorm. You and the person next to you will list 3 examples of….. Abiotic and biotic factors that affect population growth and decrease in size. Chapter 9. Population Unit. Population Dynamics.

E N D
Brainstorm • You and the person next to you will list 3 examples of….. • Abiotic and biotic factors that affect population growth and decrease in size.
Chapter 9 Population Unit
Population Dynamics • Studying how populations change in size, density, age distribution, and population distribution. • Size: number of individuals • Density: how many are in a certain area • Age distribution: proportion of each age group • Population distribution: how the organisms arrange themselves in their habitat
Population Distribution Clumping: Most common. Safety in numbers, social interaction, mating and caring for young, resources are clumped Most common. Uniform: Not as common. Used because of scarcity of resources Random: Quite rare. Can be hard to determine between truly random or largely “clumpy”
What goes up must come down • Increases in population: through birth or immigration • Decreases in population: through death or emigration. Deaths + Emigration Change in Population Births + Immigration Note: You should know difference between Immigration & Emigration!
Age Structure • What is expected to happen if a large % of the population is under the age of 10? • What is expected to happen if a large % of the population is over the age of 65? • What is expected to happen if there is an equal distribution in age? Growth will remain stable, then increase in 10-20 years Growth will decrease Growth remain stable
What stage are you? • Prereproductive stage: Those not through puberty; reproductively immature. • Reproductive stage: Those who are capable of reproduction • Postreproductive stage: Organisms that are too old to reproduce. • Note: while males are capable of reproduction longer, “survival of the fittest” can prevent them from breeding once they are too old.
Not living Sunlight Temperature Climate Chemical environment Living factors Reproduction rates Food supply Habitat Resistance to disease Ability to adapt to change Old Bio StuffAbiotic vs. Biotic FactorsThat limit population growth Biotic Abiotic
POPULATION SIZE Growth factors (biotic potential) Decrease factors (environmental resistance) Abiotic Abiotic Too much or too little light Temperature too high or too low Unfavorable chemical environment (too much or too little of critical nutrients) Favorable light Favorable temperature Favorable chemical environment (optimal level of critical nutrients) Biotic Biotic High reproductive rate Generalized niche Adequate food supply Suitable habitat Ability to compete for resources Ability to hide from or defend against predators Ability to resist diseases and parasites Ability to migrate and live in other habitats Ability to adapt to environmental change Low reproductive rate Specialized niche Inadequate food supply Unsuitable or destroyed habitat Too many competitors Insufficient ability to hide from or defend against predators Inability to resist diseases and parasites Inability to migrate and live in other habitats Inability to adapt to environmental change Biotic potential = growth Environmental resistance =decrease
A population will increase if…. • A) Natality decreases • B) Mortality increases • C) Biotic potential increases • D) The environmental resistance increases
A population will increase if…. • A) Natality decreases • B) Mortality increases • C) Biotic potential increases • D) The environmental resistance increases
Abiotic Favorable light Favorable temperature Favorable chemical environment (optimal level of critical nutrients) Biotic High reproductive rate Generalized niche Adequate food supply Suitable habitat Ability to compete for resources Ability to hide from or defend against predators Ability to resist diseases and parasites Ability to migrate and live in other habitats Ability to adapt to environmental change Any of these would take place for answer C. Biotic potential = growth
Exponential or Logistic Growth Curve? “Boom and Bust” “Boom then stable”
Environmentalresistance Carrying capacity (K) Population size (N) Biotic potential Exponential growth Time (t) Logistic Growth • Will see exponential growth at first introduction to new environment. Video to follow this lecture. • Then, growth will be limited by environmental factors and will follow carrying capacity • S shaped
Going up… • Intrinsic rate of increase (r) is the rate the population would grow if it had unlimited resources. • Can be seen as the “boom” of the population. • r species: reproduce early in life, reproduce often, have many offspring each time.
Coming down… • Overshoot occurs when the population “booms” and is too great for the resources to support • Overshoot is followed by dieback, or the sudden decrease in population • Reproductive time lag: the amount of time it takes for the birth rate to fall and death rate to rise. If the time lag is too long, environmental damage can occur which further limits the carrying capacity.
Number of individuals Time Population Graphs (b) Irregular
Number of individuals Time Population Graphs (a) Stable
Number of individuals Time Population Graphs (c) Cyclic
Number of individuals Time Population Graphs ( (d) Irruptive
Population Density • Density-dependent controls: Limits populations that are too high. Examples: competition for food, shelter, water; disease; parasites, predation • Density-independent controls: Decreases population regardless of size. Examples: weather, temperature, natural disasters, habitat destruction, chemical changes in the environment
Who’s in control here? • Top-down control: (Predator Controls Prey) • Structure of lower trophic levels depends on effect of consumers at high trophic levels. • Bottom-up control: (Prey Controls Predator) • Structure depends on prey availability and nutrient content from low trophic levels • Example: Hare population is controlled either by the lynx killing it (top-down) or by large numbers of hare using up their food source (bottom-up)
Let’s talk about sex…old bio stuff • Asexual reproduction: does not require sperm/egg. Mitosis – cell splitting. Bacteria reproduce this way. Only 3% of all species use this form • Sexual reproduction: requires sperm/egg, but not necessarily intercourse/copulation • Disadvantages: • Males don’t give birth • Increased chance of genetic defect/error • Courtship and mating rituals can be complex • Advantages: (get your mind out of the gutter!) • Genetic variety/diversity • Parents can divide responsibilities
Carrying capacity K species; experience K selection Number of individuals r species; experience r selection Time What species are you?
Found at bottom of population curve Reproduce early in life Reproduce frequently Large numbers of offspring Little to no parental care Boom and bust populations Examples: Frogs Cockroach Dandelions Mice Most insects Found at top of population curve Reproduce later in life Reproduce less frequently Have less offspring at one time Lower infant mortality Logistic graph (stable at top) Examples: Humans Elephants Whales Long-living plants (oaks, rain forest trees) Species r-selected Species K-selected Species
R-selected Species or K-selected species? HINT: The Capybara is the largest rodent in the world
Late loss 100 Constant loss 10 Percentage surviving (log scale) 1 0 Early loss Age Survivorship Curves • Early loss: high infant mortality (fish, frogs) • Constant loss: death rate even among all ages (song birds) • Late loss: low infant mortality (humans, elephants)
Isolation isn’t best… • Problems when small, isolated populations exist. • Founder effect: small group is geographically isolated. May not have the genetic diversity to survive (coloring, fur cover, etc) • Demographic bottleneck: only a few surviving individuals may not have the genetic diversity to rebuild the population • Genetic drift: some individuals breed more and dominate the gene pool (wolves) • Inbreeding: related individuals in an area mate. Can increase genetic defects.
Tying in a few things from Chapter 1
Oops! I did it again… • Past mistakes that need to be stopped: • Reducing biodiversity by destroying, fragmenting and degrading habitats
Oops! I did it again… • Past mistakes that need to be stopped: • Reducing biodiversity by simplifying natural ecosystems (monocultures – one type)
Oops! I did it again… • Past mistakes that need to be stopped: • Unintentional strengthening of pest species and anti-biotic resistant bacteria
Oops! I did it again… • Past mistakes that need to be stopped: • Elimination of natural predators (wolves, cougars, buffalo, eagles)
Oops! I did it again… • Past mistakes that need to be stopped: • Over-harvesting renewable resources
Oops! I did it again… • Past mistakes that need to be stopped: • Interfering with natural cycles in natural
Oops! I did it again… • Past mistakes that need to be stopped: • Over dependence on fossil fuels
4 Guidelines for a Sustainable Future • Our lives and economies are dependant on the earth and sun. They don’t depend on us. • Everything is interconnected. • You can’t change only one thing in nature • We cannot sustain our civilization if we deplete the natural capital. We must live off the biological interest of that capital.
Population Control Solar Energy PRINCIPLES OF SUSTAINABILITY Nutrient Recycling Biodiversity