Download
1 / 49
490 likes | 602 Views
Improving USGS Input into HAZUS & Other Loss Estimation Tools. Nicolas Luco – Research Structural Engineer Erdem Karaca – Mendenhall Postdoctoral Researcher USGS Geologic Hazards Team, Golden, CO. USGS/MAEC Workshop in Memphis, TN October 11, 2006. Presentation Topics.

E N D
Improving USGS Input into HAZUS & Other Loss Estimation Tools Nicolas Luco – Research Structural Engineer Erdem Karaca – Mendenhall Postdoctoral Researcher USGS Geologic Hazards Team, Golden, CO USGS/MAEC Workshop in Memphis, TN October 11, 2006
Presentation Topics • Improving USGS Input into HAZUS • USGS-FEMA Plan on Future Opportunities • Probabilistic Building Damage & Risk Maps • Cost-Benefit Analysis of Earthquake Provisions in Building Codes • Prompt Assessment of Global Earthquake for Response (PAGER) – D. Wald & P. Earle • An Interactive Web Tool for Quantitative Seismic Risk Assessment of Woodframe Houses (ResRisk-WH) • Open-Source Risk Modeling Software ("OpenRisk") – K. Porter & C. Scawthorn
Multi-hazard loss estimation methodology • Earthquake, flood, wind • Default databases • Building inventory, bridge inventory, … • Possible ground motion inputs • Scenario earthquakes, USGS hazard curves, ShakeMaps • Losses • Repair costs, casualties, direct & indirect economic losses
HAZUS - Pros • Integrated earthquake loss estimation methodology • Default databases • Losses for a scenario earthquakes or ground-shaking maps • Various loss measures (repair costs, number of casualties, …) • HAZUS - Cons • Not fully probabilistic (expected scenario/annual losses only) • Computational efficiency (GIS overhead) • Flexibility (not open-source)
Presentation Topics • Improving USGS Input into HAZUS • USGS-FEMA Plan on Future Opportunities • Probabilistic Building Damage & Risk Maps • Cost-Benefit Analysis of Earthquake Provisions in Building Codes • Prompt Assessment of Global Earthquake for Response (PAGER) – D. Wald & P. Earle • An Interactive Web Tool for Quantitative Seismic Risk Assessment of Woodframe Houses (ResRisk-WH) • Open-Source Risk Modeling Software ("OpenRisk") – K. Porter & C. Scawthorn
1) Improving USGS Input into HAZUS • FY06 & FY07 OMB Recommendation: Improve earthquake risk estimates by integrating the USGS Geologic Hazards Program seismic monitoring with FEMA hazard loss estimation capabilities. • FY06 Milestones (USGS Response): • Establish USGS-FEMA workgroup to develop joint plan for collaboration • Combine USGS National Seismic Hazard Maps with HAZUS methodology to generate probabilistic loss estimates • Produce prototype HAZUS-formatted ShakeMaps for destructive earthquake scenarios to facilitate generating loss estimates for the scenarios
1) Improving USGS Input into HAZUS • USGS-FEMA Plan on Future Opportunities: • Integration of USGS Seismic Monitoring with HAZUS for Earthquake Response • USGS Ground Motion “Plug-In” for HAZUS • Coordination of USGS/FEMA Earthquake Damage Research (“HAZUS-R”) • Joint Earthquake Risk Publications, Maps, and Associated Products • Example: Regional probabilistic loss distributions (i.e., beyond expected losses)
Regional Probabilistic Loss Distributions: Goal • Exceedance probability curves for total losses to a portfolio/region. • Combination of ground motion hazard, building exposure, and building fragilities.
Probabilistic Seismic Loss Analysis (PSLA) • PSHA-analogous methodology described in Wesson, Perkins, and Luco (2006): "Direct Calculation of the Probability Distribution for Earthquake Losses to a Portfolio" • Applications to date: • San Francisco Bay Area Residential Woodframe Losses (Luco et al for 2006 AGU Fall Meeting, manuscript in preparation) • Shelby County & Memphis Metro Bridges (Karaca & Luco for 5th National Seismic Conference on Bridges & Highways) • Next applications will couple USGS hazard information with HAZUS exposure data and "revamped" HAZUS fragilities (described later in presentation)
Methodology: Motivation “Loss Curve” Fragility PSHA Output • For each individual building of the exposure, the output of PSHA (i.e., a hazard curve for the site) can be coupled with the building fragility to arrive at its “loss curve”: • If the losses for individual buildings were independent, a combined loss curve could be obtained via a simple convolution, e.g., … • But the losses for individual buildings are not independent, since their sites are shaken by the same earthquake events. • Bottom Line: We can’t simply start from the output of PSHA.
Methodology: Extending PSHA • Recall that Probabilistic Seismic Hazard Analysis (PSHA) conditions on and sums over “all” potential earthquake events: • For a given "event" (defined below), the losses for individual buildings can be considered independent, and hence, e.g., … • Each “event” is defined here by: (i) M = magnitude of earthquake (ii) R = location of earthquake & corresponding distances to sites (iii) einter = measure of average ground motion relative to other similar earthquake events (i.e., # of sinter’s)
Methodology: PSLA Summary Fragility Hazard • In summary, an exceedance curve for the sum of losses to all buildings in the exposure can be obtained via the following steps: • For each potential event, combine the fragility and site hazard for each building to obtain individual loss curves, i.e., … • Convolve the individual conditional loss curves to obtain a combined loss curve for each event, e.g., … • Sum (with event weights) the loss curves for each event, e.g., …
1) Input on USGS Role in Risk Field • FY05 USGS Venture Capital Fund Project • Proposed “National Seismic Risk Maps” • M. Petersen and N. Luco met with … • FM Global • AIR Worldwide Corporation • RMS (Risk Management Solutions) • ABS Consulting (formerly EQE) • CGS (California Geological Survey) • CEA (California Earthquake Authority) • FEMA & NIBS (with D. Applegate)
1) Input on USGS Role in Risk Field • Stakeholders encouraged … • Research into vulnerabilities and risk analysis, in addition to hazard • Results that they could compare with and/or utilize • Transparent risk calculations for sensitivity studies • Contribution to exposure data (e.g., by USGS Geography) • Evaluations of available vulnerabilities • Analyses for “public” buildings (e.g., homes)
1) Input on USGS Role in Risk Field • Stakeholders discouraged … • Development of risk modeling software • Risk results that become de facto standard (i.e., do be clear about uncertainties/shortcomings of results) • Competition • Stakeholders willing to cooperate, if not collaborate (similar to response to open-source risk-modeling software)
Presentation Topics • Improving USGS Input into HAZUS • USGS-FEMA Plan on Future Opportunities • Probabilistic Building Damage & Risk Maps • Cost-Benefit Analysis of Earthquake Provisions in Building Codes • Prompt Assessment of Global Earthquake for Response (PAGER) – D. Wald & P. Earle • An Interactive Web Tool for Quantitative Seismic Risk Assessment of Woodframe Houses (ResRisk-WH) • Open-Source Risk Modeling Software ("OpenRisk") – K. Porter & C. Scawthorn
Building Risk Maps = (Memphis, TN) • Building risk maps show the mean annual frequencies (MAFs) of exceeding different structural damage states (or losses) for each of the 36 building types in HAZUS designed to 4 different code levels
Fragility Curve Vulnerability Curve Building Risk Maps P(Loss ≥ loss | Sa) (Loss | DS = ds) P(DS ≥ ds | Sa) P(DS = ds | Sa) Spectral acceleration, PGA, MMI, Inelastic spectral displacement, Inter-story drift ratio, …
Example Building Risk Maps Low Rise Steel Moment Frame Building, Low Code
Example Building Risk Maps Slight Damage
Example Building Risk Maps Extensive Damage
Slight Damage Example Building Risk Maps Low-Code High-Code
Building Damage Maps Fragility Curve Seismic Hazard • Building damage maps show the probabilities of different structural damage states(or losses) for each of the 36 building typesin HAZUS designed to 4 different code levels
Example Building Damage Maps: Northridge Eq. Low Rise Steel Moment Frame Building, Low Code
Example Building Damage Maps Light Frame Wood Building, Low Code
Presentation Topics • Improving USGS Input into HAZUS • USGS-FEMA Plan on Future Opportunities • Probabilistic Building Damage & Risk Maps • Cost-Benefit Analysis of Earthquake Provisions in Building Codes • Prompt Assessment of Global Earthquake for Response (PAGER) – D. Wald & P. Earle • An Interactive Web Tool for Quantitative Seismic Risk Assessment of Woodframe Houses (ResRisk-WH) • Open-Source Risk Modeling Software ("OpenRisk") – K. Porter & C. Scawthorn
USGS Mendenhall Postdoctoral Project • “Cost-Benefit Analysis of Earthquake Provisions in Building Codes” • In particular, reduction of losses around New Madrid Seismic Zone via adoption of seismic design maps in International Building Code (IBC) • Involves update of HAZUS fragilities to reflect IBC, and to depend on design ground motion • Also involves revamping of HAZUS fragilities for use in “Probabilistic Seismic Loss Analysis” (Wesson, Perkins & Luco, 2006)
Approach: SBC => IBC Loss/Risk Reduced Risk? Cost? Hazard Inventory Fragility/Vulnerability
HAZUS Building Fragilities Fragility Curve Input: Inelastic Spectral Displacement Capacity Curve Capacity Spectrum Method Damage State Definition
Revamping HAZUS Fragilities Fragility Curve Input: Elastic Spectral Acceleration Time History Analysis Capacity Curve Damage State Definition
Revamping HAZUS Fragilities • Revamped HAZUS fragilities are: • Based on nonlinear dynamic structural analysis rather than Capacity Spectrum Method. • Independent of ground motion variability, which is taken care of in hazard computation. • Fully probabilistic with variability in ground motion and building response properly accounted for.
Revamping HAZUS Fragilities • Revamped HAZUS fragilities are (continued): • In terms of ground motion parameters for which hazard is typically computed, e.g., Sa(0.3s). • Available for a large number of structures (all HAZUS building types and code levels). • Can be easily combined with seismic hazard information to … • Evaluate seismic risk, e.g. seismic risk maps. • Estimate losses from a scenario event, e.g. seismic damage maps. • Evaluate building design/mitigation options, e.g. SBC vs IBC design.
Approach: SBC => IBC (Current/Future Work) Reduced Risk Cost
Presentation Topics • Improving USGS Input into HAZUS • USGS-FEMA Plan on Future Opportunities • Probabilistic Building Damage & Risk Maps • Cost-Benefit Analysis of Earthquake Provisions in Building Codes • Prompt Assessment of Global Earthquake for Response (PAGER) – D. Wald & P. Earle • An Interactive Web Tool for Quantitative Seismic Risk Assessment of Woodframe Houses (ResRisk-WH) • Open-Source Risk Modeling Software ("OpenRisk") – K. Porter & C. Scawthorn
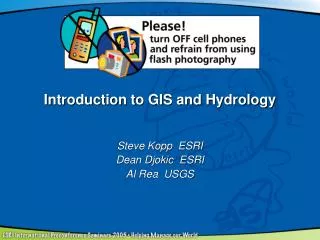
Relevant Other USGS Studies/Products: PAGER • Prompt Assessment of Global Earthquakes for Response • is an automated alarm systembeing developed to rapidly and accurately assess the severity of damage caused by an earthquake and to provide emergency relief organizations, government agencies, and the media with an estimate of the societal impact from the potential catastrophe. • will distribute alarms via pager, mobile phone, and e-mail that will include a concise estimate of the earthquake’s impact. • will also report the earthquake location, magnitude, and depth, an estimate of the number of people exposed to varying levels of shaking, a description of the region’s vulnerability, and a measure of confidence in the system’s impact assessment. • information will be available within minutes of the determination of the earthquakes location and magnitude
Relevant Other USGS Studies/Products: PAGER 1. Ground Shaking Estimate 2. Population Data 3. Ground Shaking and Exposure 4. Impact Estimate • Pager Process
Presentation Topics • Improving USGS Input into HAZUS • USGS-FEMA Plan on Future Opportunities • Probabilistic Building Damage & Risk Maps • Cost-Benefit Analysis of Earthquake Provisions in Building Codes • Prompt Assessment of Global Earthquake for Response (PAGER) – D. Wald & P. Earle • An Interactive Web Tool for Quantitative Seismic Risk Assessment of Woodframe Houses (ResRisk-WH) • Open-Source Risk Modeling Software ("OpenRisk") – K. Porter & C. Scawthorn
4) Plan for Residential Risk Web Tool • Ultimate goal: An interactive web tool for quantitative seismic risk assessment of woodframe houses (“ResRisk–WH”) • Phase I plan for FY07 (w/ N. Field & K. Porter) • Java module – Standalone & OpenSHA application • Input: Zip code Vulnerability relation (dropdown menu) • Output: Loss exceedance probability curve ( including probability of exceeding deductible, expected loss )
Loss Exceedance Probability Curve Select Vulnerability Relation Loss Ratio CUREE Small House, Typical Quality CUREE Small House, Braced Cripple Wall CUREE Large House, Typical Quality . . . Wesson et al. Single-Family Home, ShakeMap PGA
4) Plan for Residential Risk Web Tool • “Phase II” Plan for Future Work • Supplement available vulnerability relations to adequately represent exposure in Northridge ‘94 • Validate/calibrate vulnerability relations using data from Northridge ’94 earthquake • “Phase III” Plan for Future Work • Derive vulnerability relation “on-the-fly” based on user-inputted floor plans • Would result in user-assembled database of vulnerability relations (not tied to an address)
Presentation Topics • Improving USGS Input into HAZUS • USGS-FEMA Plan on Future Opportunities • Probabilistic Building Damage & Risk Maps • Cost-Benefit Analysis of Earthquake Provisions in Building Codes • Prompt Assessment of Global Earthquake for Response (PAGER) – D. Wald & P. Earle • An Interactive Web Tool for Quantitative Seismic Risk Assessment of Woodframe Houses (ResRisk-WH) • Open-Source Risk Modeling Software ("OpenRisk") – K. Porter & C. Scawthorn
5) "OpenRisk" • Like HAZUS, multi-hazard & freeware • Unlike HAZUS, an open-source code base • R. Murnane (BBSR-RPI) held a workshop in March of 2005 (www.open-risk.org) • K. Porter & C. Scawthorn (SPA) have … • been funded by SCEC to draft initial plan • obtained programming support from Russia • A proposal to further "OpenRisk" is pending with USGS NEHRP External Grants Program • USGS development of ResRisk-WH is contributing to OpenRisk code base (Java)
Presentation Topics • Improving USGS Input into HAZUS • USGS-FEMA Plan on Future Opportunities • Probabilistic Building Damage & Risk Maps • Cost-Benefit Analysis of Earthquake Provisions in Building Codes • Prompt Assessment of Global Earthquake for Response (PAGER) – D. Wald & P. Earle • An Interactive Web Tool for Quantitative Seismic Risk Assessment of Woodframe Houses (ResRisk-WH) • Open-Source Risk Modeling Software ("OpenRisk") – K. Porter & C. Scawthorn
HAZUS – Example: • Expected Annual Loss (EAL) using USGS PSHMs • Not a true loss exceedance curve Area under Curve = EAL
Example: Earthquake Events & GM’s (Hazard) • San Francisco Bay Region • Characteristic and floating earthquake events from USGS Working Group 2002 • 4 attenuation relations for ground motions • sinter based on Lee & Anderson (BSSA, 2000) • 3 different hazard programs used to compute median and dispersion of ground motion for each earthquake event and building site pair
Example: Buildings & Sites (Exposure) • Residential Woodframe Buildings – Inventory from HAZUS • Aggregated at census tract level • Within each census tract, one site per NEHRP site classification
Components of Risk/Loss Analysis • HAZARD e.g., National Seismic Hazard Maps, ShakeMaps • EXPOSURE e.g., HAZUS Inventory Data, USGS Geography • FRAGILITY (or VULNERABILITY) e.g., HAZUS Fragilities, Wesson et al (2004) • RESILIENCY e.g., Insurance, Cat. Bonds, Emergency Response