Download
1 / 23
230 likes | 245 Views
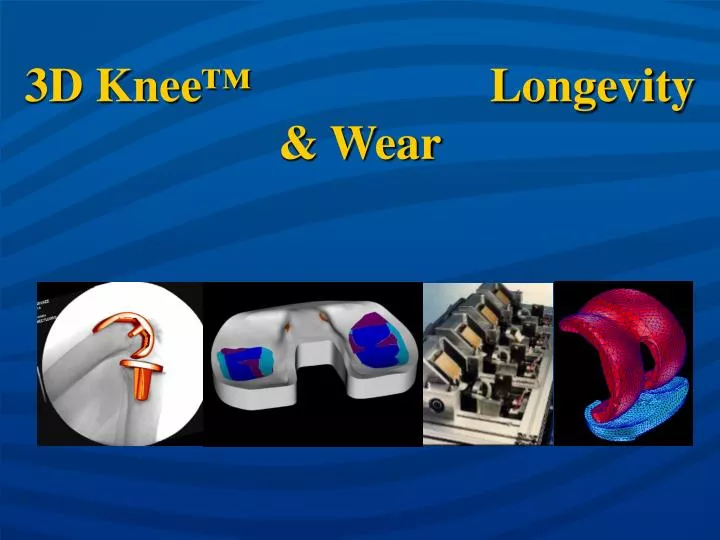
3D Knee ™ Longevity & Wear. Why Knees Fail?. 212 consecutive revised TKA, 1997-2000 Sharkey et al., CORR, 404, 2002. in vivo 6.6 years. Retrieved LCS ( Harman, ISTA 2003). Key Observations . Contact area for many TKR designs decreases with increased flexion > 20°

E N D
Why Knees Fail? • 212 consecutive revised TKA, 1997-2000 • Sharkey et al., CORR, 404, 2002
in vivo 6.6 years Retrieved LCS (Harman, ISTA 2003) Key Observations • Contact area for many TKR designs decreases with increased flexion >20° • Bourne, Clin Orthop 2003 • Small areas and high contact stress increases potential for PE wear and delamination
3D Knee™ Articular Design • Fully congruent lateral compartment • Widened medial condyle • Constant sagittal profile > 70° flexion
3D Knee™ Contact Area and Stress Evaluated Using Finite Element Models • “Activity Model” of Gait, Stair, Squat • Morra & Greenwald, ORL, Cleveland OH • 2.5 – 4.5 BW loads • Flexion angles 0° - 135° • Non-linear UHMWPe material properties • Measured actual manufactured implants
Contact Area and Stress at Heel Strike 3D Knee™ vs. Fixed Bearing TKR Designs Contact Stress Contact Area Stress Range 3D Knee 3D Knee NKII Ultra NKII Ultra GenesisII GenesisII CR CR PFC Sigma PFC Sigma Curve Curve Duracon Duracon 0 10 20 30 40 0 100 200 300 400 Contact Area (mm2) Contact Stress (MPa) Competitive data from: Morra, Harman, Greenwald: Computational models can predict polymer insert damage in total knee replacements. Surgery of the Knee 4th Edition (Eds. Insall & Scott), 1(13):271-83, 2006
Contact Area during High Flexion Activities 3D Knee™ vs. “High Flexion” TKR Designs 3D Knee PFC Sigma RPF Contact stresses < 20 MPa during stair climbing Legacy LPS- Squat (135) Flex Fixed Chair (90) Stair (60) 3D KneeTM has 32% - 61% greater contact area during stair climbing compared to other “high flexion” designs 0 100 200 300 400 500 Contact Area (mm2) Includes post/cam contact area Competitive data from: Morra, Greenwald: Polymer insert stress in TKR designs during high flexion activities. AAOS 2005
3DKneeTM Wear Test III: 3DKneeTM Wear Test • Industry Contract Between DJO Surgical and Clemson University • Clemson UniversityBioTribology Laboratory • Testing occurred between June - December 2007
Instron/Stanmore 4-station force-controlled knee simulator 25% bovine serum at 37°C 5 million cycle tests Dynamic Wear Test Data Avg. weight loss was less than other designs
Results: TKR Kinematics III: 3DKneeTM Wear Test • Lateral Pivoting Observed During Walking PLAY VIDEO Simulator Video 2
Highly Cross-linked vs. Non-cross-linked IV: Comparisons to the Literature GUR 105050% BS GUR 4150?% BS GUR 4150100% BS GUR 102050% BS DJO Surgical 3DKneeTM
3D Knee™ – Retrieval Analysis • 100 knees @ 2-5 year follow-up • 4 retrieved UHMWPe inserts • 1 Male, 3 Female • Age at Index: 58-72 • BMI: 27-33 • Reasons for Revision • Infection (2) at 11 and 13 mos. • Hemarthrosis (1) at 7 mos. • Diabetic capsulitis (1) at 6 mos.
7 Mon. 6 Mon. L M L M 11 Mon. 13 Mon. L M L M Scratches Abrasion Emb. Debris Delamination Burnish Striations Indistinguishable Creep Pits UHMWPe Articular Damage Pattern • Dominant wear mode is burnishing, with some scratching & pitting • Damage consistent with observations from other designs with short functional duration
Conclusions V: Conclusions • Wear Testing Simulators at Clemson University Performed To ISO Force-Control Standards • 3DKneeTM system exhibited very low wear rate • 3DKneeTM simulation confirms lateral pivot design • 3DKneeTM outperforms a majority of published competition
Analysis of 3D Knee™ Results: Clinical Outcomes at 5 Years WA Hodge1,2,3, MK Harman2, A. Mori2, SA Banks2,3,4 1Hodge BioMotion Orthopaedics, Good Samaritan Medical Center, West Palm Beach, FL, USA 2Institute for Mobility & Longevity, West Palm Beach, FL, USA 3Dept. of Mechanical & Aero Engineering, Univ. of Florida, Gainesville, FL, USA 4Dept. of Orthopaedics & Rehabilitation, Univ. of Florida, Gainesville, FL, USA Research grants have been received in support of these studies. One or more authors are paid consultants and/or receive royalties from DJO Surgical (Encore Medical).
5 Year Clinical Outcomes of“ACL substituting” TKR Design using Standard Approach 509 knees • Nov 2001-Aug 2008 • 235 males, 274 females • Age: 73+9 (30-93) yrs • Weight: 83+18 (50-159) kg • BMI: 28+5 (19-55)
100 knees in 88 patients Avg. follow-up: 4.2 (3-6) years surgery Nov. 2001 – Aug. 2004 45 males, 55 females Age: 73+8 (43-88) years Weight: 81+16 (51-121) kg BMI: 28+5 (20-40) Diagnosis OA - 90 knees RA - 10 knees Initial 100 “ACL substituting” TKR with Average 4 Year Follow Up
Knee Society Score (pain, function) Range of motion “Digital Goniometer” tool for computerized measurement of digital radiographs Outcome Measures JR090 at 2 yrs.
Knee Society Scores (Pain/Motion) 5 years 2 year 3 year 1 year 98+4 3 mos 97+7 96+7 97+5 100 92+11 80 Pre-Op 60 47+11 40 20 0 Mean Knee Society Score (Pain/Motion)
Knee Society Scores (Function) 5 years 2 year 3 year 1 year 95+10 97+7 95+11 95+12 100 3 mos 85+20 80 Pre-Op 60 51+12 40 20 0 Mean Knee Society Score (Function)
Passive Flexion 5 years 130 2 year 3 year 1 year 121+10 121+10 121+10 119+10 3 mos 120 113+12 Pre-Op 107+8 110 100 90 80 Mean Passive Flexion (deg) At last follow-up, 68% have > 120° of flexion
Radiographic Results • Pre-Op (3:1 varus : valgus) • Varus 183° (176°-196°) • Valgus 170° (156°-175°) • Limb correction = 6° (0°-15°) • Post-op Alignment @ avg. 4 yrs. • AP Limb = 176°+3° valgus • Tibial Slope = 5°+4° • Patellar Tilt = 3°+3° • TKR radiolucent lines • 4 TKR exhibited “wide” RLL at 5 years • All showed no progression from 3 years • 3 patients had clinically recurrent effusions
Thank You West Palm Beach, Florida USA