Download
1 / 46
460 likes | 553 Views
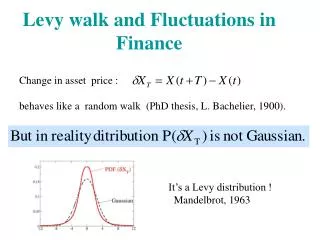
ITPA CDBM and Transport meetings - Spring 2007 at EPFL Lausanne. Transport and fluctuations in LHD and comparisons with tokamaks.

E N D
ITPA CDBM and Transport meetings - Spring 2007 at EPFL Lausanne Transport and fluctuations in LHD and comparisons with tokamaks K. Tanaka1), C. Michael1), L.N. Vyacheslavov4), H.Yamada1), M. Yokoyama1) O.Yamagishi1), H. Takenaga2), K. Muraoka3), H.Urano2), S. Murakami5), A. Wakasa6) and LHD Experimental group 1) National Institute for Fusion Science, 322-6 Oroshi, Toki, 509-5292, Japan 2) Japan Atomic Energy Agency 801-1 Mukouyama Naka Ibaraki, 311-0193, Japan 3) School of Engineering, Chubu University, 1200 Matsumoto, Kasugai, Aichi 487-8501 4) Budker Institute of Nuclear Physics, 630090, Novosibirsk, Russia 5) Department of Nuclear Engineering, Kyoto University, Kyoto 606-8501, Japan 6) Graduate School of Engineering, Hokkaido University, Sapporo, 060-8628, Japan
The motivation of comparison study between helical/stellarator and tokamak is to understand common underlined physics of transport. There is a similarity and dissimilarity between helical/stellarator and tokamak Similarity Both global energy confinements scaling (IPB98(y2) for tokamak and ISS04 for helical/stellarator) are similar and are Gyro Bohm like . Dissimilarity Shape of density profile.
Outline of talk • Comparison of global energy confinement scaling between tokamak and helical/stellarator • Role of neoclassical optimization on anomalous transport. • Particle transport of LHD • Experimental turbulence study in LHD
International sterraltor scaliing 04 (ISS04) is dimensionally similar to IPB98(y,2) on r*. Both are weak Gyro Bohm(H.Yamada N.F.1684 (2005)) ITER tokamak LHD In Gyro Bohm like transport, transport is turbulence driven, of which wave length is order of ion Larmor radius. H. Yamada, Nucl. Fusion 45 (2005) 1684 Tokamak Ip are treated through q2/3 into stellarator scaling.
In LHD, edge (r=0.7~1.1) fluctuation level measured by phase contrast imaging (PCI) increases with increase of edge diffusion coefficient. This is similar to tokamak observation. K.Tanaka Fusion Sci. Tech. (2007)97 kperpri~0.5. This is expected by linear calculation of GOBLIN code. In tokamak, smaller peak wavenumber kperpri~0.1 was reported anywhere. Edge transport influence global confinement. Similar fluctuation character may results in similar r* scaling
The particularity of helical/stellarator is enhanced neoclassical transport in low collision regime tokamak helical/stellarator Future operation regime of reactor Future operation regime of reactor Experimental De,ce Experimental De,ce Around one order Around one order Neoclassical Transport coefficient Neoclassical Transport coefficient 1/n regime Banana regime Plateau regime Plateau regime nei nei Plateau regime 1/n regime S. Murakami Nucl. Fusion 42 (2002) L19–L22 In 1/n, neoclassical transport is minimum at Rax=3.53m In Plateau, neoclassical transport is smaller at more inward axis. Dneo/Dtokamak plateu Dneo/Dtokamak plateu Axis Position Axis Position Outward shifted Inward shifted Inward shifted Outward shifted
Magnetic axis position change magnetic helical ripple and higher ripple results in larger neoclassical transport Helical coil Plasma B contour HC-I Shifts by external vertical field and Shafranov shifts Flux Surface Orbit of guiding center
Energy confinement is improved by shift of magnetic axis position Inward shift of Rax Optimization in terms of drift optimization 0.6 0.03 Smaller helical ripple Smaller helical ripple Neoclassical optimization is successful ! Much more than neoclassical theory !? Effect of neoclassical transport is pronounced in collisionless regime Confinement improvement by the inward shift of Rax still exists in collisional regime
One of the key parameter to determine global energy is eh_eff, which is representative amplitude of magnetic helical ripple ∝eeff-0.4 Representative helical ripple amplitude at r=2/3 H. Yamada, Nucl. Fusion 45 (2005) 1684
Summary of global energy confinement in LHD • Global energy confinements are gyro Bohm character and edge particle diffusion (~edge thermal conductivity ~ global energy and particle transport) are dominated by turbulence (kperpri~0.5) driven transport. • With smaller magnetic ripple (inward shifted configuration and smaller neoclassical transport), energy transport is reduced. • Reduced neoclassical configuration introduce smaller anomalous transport. • Recent non linear gyro kinetic simulation support this. At reduced neoclassical configuration with smaller magnetic helical ripple, zonal flow can be more induced, then turbulence is supressed. (Sugama, Watanabe P.R.L. 94,115001,(2005), Watanabe, Sugama, 21st FEC IAEA-CN-149/EX/5-4)
Different character of density profiles are observed in JT60U and LHD LHD Rax=3.6m JT60U Elmy H mode Density scan at PNBI=8-10MW PNBI scan at similar averaged density
Magnetic axis position changes density profile as well. Inward shifted Small magnetic helical ripple and reduced neoclassical transport Outward shifted Large magnetic helical ripple and enhanced neoclassical transport
Example of transport analysis NBI 11.4MW NBI 1.7MW Impurity may not account for ne profile Higher Te gradient induce outward convection D is anomalous. Vout is comparable Vneo.
Density modulation experiments shows Dcore is anomalous, outward Vcore is comparable with neoclassical one Rax=3.6n, Bt=2.75, 2.8T Rax=3.6n, Bt=1.49T Rax=3.75n, Bt=1.5T Rax=3.9n, Bt=1.54T Dedge Vcore Dcore 1.0 r 0.7 r Vedge 0.7 Dneo 1/n Plateau n*h Blank; Experiment, Colored; Neoclassical Inward Vcore is not neoclassical. At lower collisionality Dcore is close toDneo.
Core particle flux is zero. In core region of hollow density profile, outward neoclassical pinch is balanced with inward anomalous diffusion. G~0 in core (r<~0.9), since source~0, -Dgrad ne~neV neV Outward neoclassical convection -D grad ne Inward anomalous diffusion. Total flux~0 Inward directed anomalous flux is predicted by linear theory (O.Yamagishi 14. 012505 (2007) )
Summary of particle transport in LHD • One of the particularity of the helical/stellarator is particle transport. Hollow density profiles are often observed. This is clear contrast that density profile is always peaked in tokamak. • Enhanced neoclassical transport introduces hollow density profile. • Peaked density profile is obtained at reduced neoclassical configuration and is likely to be driven by anomalous process. • Particle diffusion is anomalous, outward convection is comparable with neoclassical value. Inward pinch is against neoclassical prediction. • Linear gyro kinetic calculation suggests the balance of turbulence driven flux and neoclassical flux produce hollow density profile.
Principle of 2D PCI B top B bottom Top view of integrated fluctuation Top view of upper fluctuation Laser Beam Upper field Top view of lower fluctuation Lower field Propagation direction tells spatial points of fluctuation.
k(mm-1) r Example signal of 2D PCI 17.5mm Spatial 2D Fourier Transform Fluctuation of lower part Fluctuation of upper part 6.1mm Integrated 2D picture with 8x6=48ch 2D array Present resolution is a/3~a/5. Signal suffers from cancellation effects A.Sanin et al., Rev. Sci. Instrum., Vol. 75, No.10, (2004) pp.3439-3441 C. Michael et al., , Rev. Sci. Instrum. 77, 10E923 (2006) L.N.Vyacheslavov et al.,IEEE special issue of plasma image Vol.33. (2005) pp.464-465
Velocity spectrum shows ExB branch and i-diamag branch i-diamag. direction i-diamag. direction Core low k and egde e-diamg. high k propagate ExB rotation speed. VExB Edge i-diamg components propagates in i-diamag direction in plasma frame Strong velocity shear in edge may reduce transport.
Edge Ion diamag. components show possible correlation with edge diffusion. Fluctuation level becomes larger at outward shifted configuration
New attempts to measure direct contribution of fluctuation to transport Fluctuation induced energy and particle flux is given by We measure and ,then, we tried to estimate fluctuation induced flux from edge PCI signal around r=1.0. Signal is line integrated, but radially dominated 2.5<l<30mm
When NBI power reduced ( transport should have reduced as well), fluctuation induced flux reduced at outside of LCFS 1.767sec 1.933sec Outward Flux Inward Flux krs~0.2 Outside of LCFS, Inside of LCFS
Bursting signal contributes flux a lot. Outward Flux Outward velocity Inward Flux Inward velocty Mean~0 Large amplitude burst take 20% of all time but make 80% of averaged flux Detail consideration is necessary about integration effects of signal. Amplitude
Summary of fluctuation Study • 2D phase contrast is working to measure fluctuation profile using magnetic shear technique. • The results shows different k branch in core and edge. • Edge ion diamagnetic components play role on edge particle transport (~global particle transport) • Edge velocity shear may play important role on reduced transport • Core fluctuation is likely play role on density profile. • Preliminary data was obtained to estimate fluctuation induced flux. Fluctuation induced flux is reduced when beam power is reduced and total transport is reduced.
Commercial reactor 2 10 Ignition ITER 1 Break even 10 LHD target 0 10 keV s) D D LHD achievement + -1 10 -3 Increase of heating power Fusion Triple Product m 20 -2 10 (10 Tokamak achievements -3 10 Day Month Hour Min. -4 10 -1 0 1 2 3 4 5 6 7 10 10 10 10 10 10 10 10 10 Discharge Duration Time(sec) Summary of achieved parameter of LHD Achieved Value[Target] Central ion temperature 13.5keV at 0.3x10¹⁹m-3(Ar plasma) 5keV at 1.2x10¹⁹m-3 (H plasma) [10keV at2x1019m-3] Central electron temperature 10keV at 0.5x10¹⁹m-3 [10keV at 2x10¹⁹m-3] Volume Averaged beta 5.0 % at 0.425T [≧ 5 % at 1~2T ] Central electron density 1x10²¹m-3 at Te(0)= 0.4keV) 〔40x1019m-3 〕 Stored Energy 1.44MJ 〔4MJ 〕 Steady State operation 31min. 45sec (700 kW) 1.3GJ 54 min 28sec (500 kW)1.6GJ [1hour (3,000kW)] High density and stable operation are advantage
Core fluctuation may play role on density profile shaping.Most of fluctuation components exists in ITG/TEM unstable region Helical particular. Inward turbulence driven flux can be balanced with outward neoclassical Tokamak like. Turbulence transport produce peaked profile
Analysis of fluctuation profiles and phase velocity 2 • Which direction in the plasma frame do fluctuations propagate? • Analyze fluctuation phase velocity profile • Compare with +NBI CVI CX measurement of vExB • Compare with drift velocity • Appear to be 3 fluctuation “peaks” • Peaks 1 and 2 propagate close to electrondrift velocity. Possibly electron drift waves? • Fluctuation amplitude is peaked in regions where Er shear is zero. More than coincidence? • Compare radial profiles of fluctuation amplitude with parameter profiles • Characteristics can vary widely among discharges. This is one example. 1 3 #60334 t=2.22s Rax=3.6m, B=-2.75T
Spatial profile of k spectrum shows three different branch High k (k~0.7mm-1) ion diamag. High k (k~0.7mm-1) electron diamag. Low k (~0.3mm-1)
However Er shearing rate may moderates ITG. gITG by GOBLIN code does not show good agreements with observations yet Rax=3.6m, 1.49T, Dedge=0.18m2/sec Rax=3.75m, 1.5T, Dedge=0.42m2/sec Rax=3.9m, 1.54T, Dedge=0.57m2/sec
Turbulence spectrum Real plasma is turbulent. And its spectrum is two dimensionally broad in the cross section perpendicular to B. We measures Fourier components perpendicular to beam axis in broad spectrum Does the measured signal represent local fluctuation?
One of the key parameter to determine global energy and particle confinements is eh_eff, which is representative amplitude of magnetic helical ripple helical/stellarator database ∝eeff-0.4 H. Yamada, Nucl. Fusion 45 (2005) 1684 Scatter of data suggests there are other hidden parameter.
Tokamak Ip are treated through q2/3 into stellarator scaling. The value at r=2/3 is a good approximation of the volume averaged value.
Experimental values are compared with neoclassical ones. In the following equation, D1,D2,Er were calculated by GSRAKE and DCOM code. Neoclassical convection term was defined as following. The thermo diffusion term (the second and third term) dominates for electron particle transport in the present experiment regime.
Rax=3.6n, Bt=2.75, 2.8T Rax=3.6n, Bt=1.49T Rax=3.75n, Bt=1.5T Rax=3.9n, Bt=1.54T Dedge Vcore Dcore 1.0 r 0.7 r Vedge 0.7 Dneo 1/n n*h Blank; Experiment, Colored; Neoclassical
The volume averaged value of rotational transform is more appropriate than the surface value. Limiter insertion in LHD li dependence in tokamaks JT-60U Y.Kamada et al. NF (1993) JT-60U, TFTR The value at r=2/3 is a good approximation of the volume averaged value.
Comparison with Tokamak Database : Provisional Translation of Ip to i Take the value of the rotational transform at r=2/3 Different definition of a Reasonable reconsideration of profile effect is allowed.
Scaling investigations ISS04: renormalization Ref.: H. Yamada et al. NF 45 (2005)
ergodic layer m/n=1/1 island separatrix LCFS baffle pump LCFS LID head core plasma baffle (plan) to pump HD separatrix (disappeared) Clear difference of density profiles are observed between LID and HD HD LID HOLLOW FLAT Radial Electric Field By GSRAKE code Temperature Density Helical Diverter (HD) Local Island Diverter (LID)
Enhanced particle transport is observed on LID LID,HD This is good material to study role of turbulence on particle confinements
Electromagnetic GK mode equation • Collisionless • F0=FM • E0=0 [1] J.B.Taylor, et al., Plasma Physics 10, 479 (1968) [2] G.Rewoldt, et al., Phys. Fluids 25, 480 (1982)
ITG results in HD/LID configurations a LID • ITG growth rate is larger in LID than in HD, • and unstable range is also broader in LID. • This is reasonable just because 1/LT is larger in LID. • - The value of growth rate can be related to the value of T. • - But, the unstable range should be only related to 1/LT, • i.e., large f’(ρ) of T=T0f(ρ), not large T0, is relevant. • The effects of 1/Ln or η on ITG growth rate • seems weak compared to 1/LT. HD (k⊥ρthi=0.5) Relative density gradient Relative temperature gradient
a2 Linear growth rate .vs. Er shearing rate Heuristically the condition, γlin(Er=0) <= ωE can stabilize the modes in finite background Er [Hahm, Burrell, ’95 PoP] GSRAKE (Yokoyama) Neoclassical Er shearing rate is insufficient to suppress the ITG growth rate.
Comparison of i-dia branch amplitude and ITG growth rate LID HD small particle transport Large particle transport Amplitude in i-dia branch (edge) scales with calculated ITG growth rate. Profiles of growth rate and observed amplitude are similar.