Download
1 / 1
10 likes | 121 Views
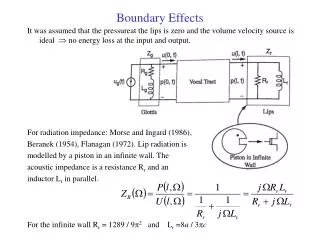
LNOx Influence on Tropospheric O 3. OMI Trop. NO2 NLDN LNOx. 16 Aug 2006. 16 Aug 2006.

E N D
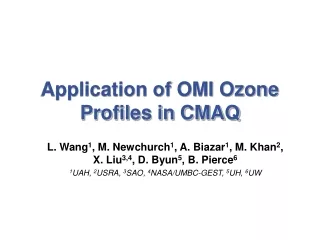
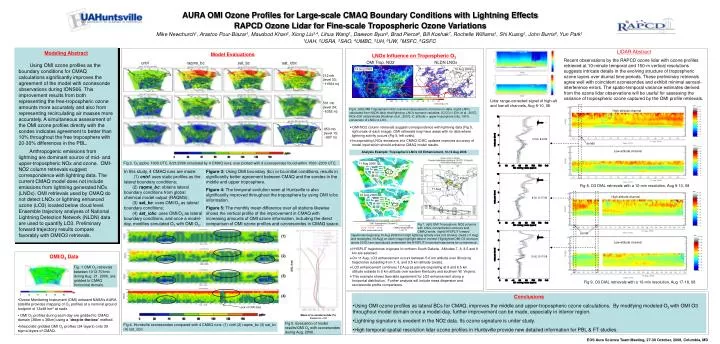
LNOx Influence on Tropospheric O3 OMI Trop. NO2 NLDN LNOx 16 Aug 2006 16 Aug 2006 Fig 6. (left) OMI Tropospheric NO2 columns interpolated to minimize no-data. (right) LNOx calculated from NLDN daily total lightning. LNOx scenario variables: IC/CG=1 [Ott, et al., 2007], NOx=500 moles/stroke [Hudman et al., 2007], IC altitude = upper troposphere only, 100% conversion of LNOx to LO3. • OMI-NO2 column retrievals suggest correspondence with lightning data (Fig 5, right ovals of each image). OMI retrievals may have areas with no data where lightning activity occurs (Fig 5, left ovals). • Incorporating LNOx emissions into CMAQ IC/BC updates improves accuracy of model input which should enhance CMAQ model results. Analysis Example: Tropospheric LNOx O3 Enhancement, 10-12 Aug 2006 11 Aug 2006 12 Aug 11 Aug OMI Tropospheric Column O3 Fig 7. (left) OMI Tropospheric NO2 columns with LNOx concentration contours and CMAQ winds. (right) HYSPLIT forward CMAQ Model Winds (Layer-27) 1 e+13 4 e+15 1 e+16 LNOx (molecules/cm2) trajectories beginning 10 Aug 2006 from high lightning activity area (not shown). Ovals (11 Aug) and rectangles (12 Aug) on each image highlight data of interest. Highlighted OMI-O3 contours above 50 DU are reproduced underneath the HYSPLIT horizontal trajectories for convenience. • HYSPLIT trajectories originate in northern South Dakota. Altitudes 7, 8, 8.5 and 9 km are selected. • On 11 Aug, LO3 enhancement occurs between 5-6 km altitude over Illinois by trajectories subsiding from 7, 8, and 8.5 km altitude (ovals). • LO3 enhancement continues 12 Aug as parcels originating at 8 and 8.5 km altitude subside to 5 km altitude over eastern Kentucky and southern W. Virginia. • This example shows favorable agreement for LO3 enhancement along a horizontal distribution. Further analysis will include mass dispersion and ozonesonde profile comparisons. 12 Aug 2006 Lack of OMI data AURA OMI Ozone Profiles for Large-scale CMAQ Boundary Conditions with Lightning Effects RAPCD Ozone Lidar for Fine-scale Tropospheric Ozone Variations Mike Newchurch1, Arastoo Pour-Biazar1, Maudood Khan2, Xiong Liu3,4, Lihua Wang1, Daewon Byun5, Brad Pierce6, Bill Koshak7, Rochelle Williams1, Shi Kuang1, John Burris8, Yun Park1 1UAH, 2USRA, 3SAO, 4UMBC, 5UH, 6UW, 7MSFC, 8GSFC Modeling Abstract Using OMI ozone profiles as the boundary conditions for CMAQ calculations significantly improves the agreement of the model with ozonesonde observations during IONS06. This improvement results from both representing the free-tropospheric ozone amounts more accurately and also from representing recirculating air masses more accurately. A simultaneous assessment of the OMI ozone profiles directly with the sondes indicates agreement to better than 10% throughout the free troposphere with 20-30% differences in the PBL. Anthropogenic emissions from lightning are dominant source of mid- and upper-tropospheric NOx and ozone. OMI-NO2 column retrievals suggest correspondence with lightning data. The current CMAQ model does not include emissions from lightning generated NOx (LNOx). OMI retrievals used by CMAQ do not detect LNOx or lightning enhanced ozone (LO3) located below cloud level. Ensemble trajectory analyses of National Lightning Detection Network (NLDN) data are used to quantify LO3. Preliminary forward trajectory results compare favorably with OMI/O3 retrievals. LIDAR Abstract Recent observations by the RAPCD ozone lidar with ozone profiles retrieved at 10-minute temporal and 150-m vertical resolutions suggests intricate details in the evolving structure of tropospheric ozone layers over diurnal time periods. These preliminary retrievals agree well with coincident ozonesondes and exhibit minimal aerosol-interference errors. The spatio-temporal variance estimates derived from the ozone lidar observations will be useful for assessing the variance of tropospheric ozone captured by the OMI profile retrievals. Model Evaluations cntrl raqms_bc sat_bc sat_icbc 212 mb (level 33; ~11584 m) Lidar range-corrected signal of high-alt and low-alt channels, Aug 9-10, 08 501 mb (level 24; ~5352 m) High-altitude channel 853 mb (level 15; ~867 m) 13:50, 8/9/08 sonde Low-altitude channel Fig 3. O3 (ppbv) 1900 UTC, 8/21/2006 simulated by 4 CMAQ runs; over plotted with 9 ozonesondes found within 1500~2300 UTC. In this study, 4 CMAQ runs are made: (1) cntrl: uses static profiles as the lateral boundary conditions; (2) raqms_bc: obtains lateral boundary conditions from global chemical model output (RAQMS); (3) sat_bc: uses OMI/O3 as lateral boundary conditions; (4) sat_icbc: uses OMI/O3 as lateral boundary conditions, and once a model-day, modifies simulated O3 with OMI O3. Figure 3: Using OMI boundary (bc) or bc+initial conditions, results in significantly better agreement between CMAQ and the sondes in the middle and upper troposphere. Figure 4: The temporal evolution seen at Huntsville is also significantly improved throughout the troposphere by using OMI ic/bc information. Figure 5: The monthly mean difference over all stations likewise shows the vertical profile of the improvement in CMAQ with increasing amounts of OMI ozone information, including the direct comparison of OMI ozone profiles and ozonesondes in CMAQ space. Fig 8. O3 DIAL retrievals with a 10-min resolution, Aug 9-10, 08 High-altitude channel 8:00, 8/17/08 sonde (1) (2) (3) (4) Low-altitude channel AGL (km) OMI/O3 Data 13:00, 8/17/08 Fig. 1 OMI O3 retrievals between 1013-701mb during Aug. 21, 2006, are gridded to CMAQ horizontal domain. Fig 9. O3 DIAL retrievals with a 10-min resolution, Aug 17-18, 08 • Conclusions • Using OMI ozone profiles as lateral BCs for CMAQ, improves the middle and upper-tropospheric ozone calculations. By modifying modeled O3 with OMI O3 throughout model domain once a model-day, further improvement can be made, especially in interior region. • Lightning signature is evedent in the NO2 data. Its ozone signature is under study. • High temporal-spatial resolution lidar ozone profiles in Huntsville provide new detailed information for PBL & FT studies. • Ozone Monitoring Instrument (OMI) onboard NASA’s AURA satellite provides mapping of O3 profiles at a nominal ground footprint of 13x48 km2 at nadir. • OMI O3 profiles during each day are gridded to CMAQ domain (36km x 36km) using a “drop-in-the-box” method. • Interpolate gridded OMI O3 profiles (24 layers) onto 39 sigma layers of CMAQ. Mean of (x-sonde)/sonde (%) Sample size = 263 Fig 5. Evaluation of model results/OMI O3 with ozonesondes during Aug. 2006. Fig 4. Huntsville ozonesondes compared with 4 CMAQ runs: (1) cntrl (2) raqms_bc (3) sat_bc (4) sat_icbc EOS Aura Science Team Meeting, 27-30 October, 2008, Columbia, MD