Download
1 / 12
120 likes | 210 Views
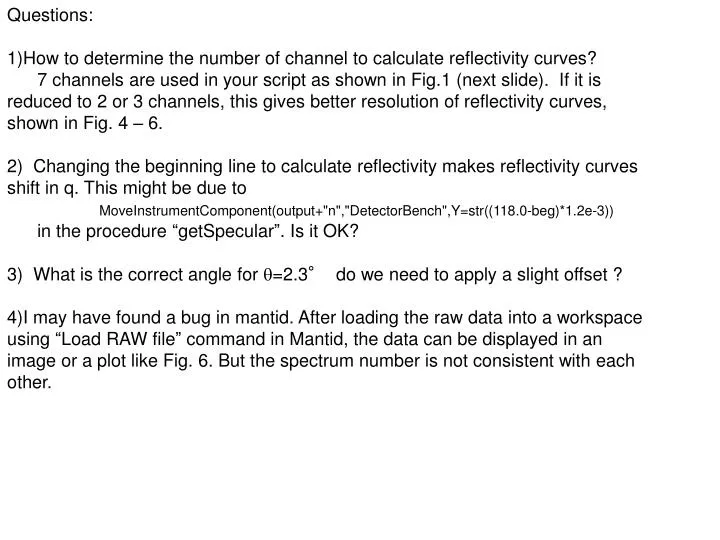
Questions: How to determine the number of channel to calculate reflectivity curves? 7 channels are used in your script as shown in Fig.1 (next slide). If it is reduced to 2 or 3 channels, this gives better resolution of reflectivity curves, shown in Fig. 4 – 6.

E N D
Questions: • How to determine the number of channel to calculate reflectivity curves? • 7 channels are used in your script as shown in Fig.1 (next slide). If it is reduced to 2 or 3 channels, this gives better resolution of reflectivity curves, shown in Fig. 4 – 6. • 2) Changing the beginning line to calculate reflectivity makes reflectivity curves shift in q. This might be due to • MoveInstrumentComponent(output+"n","DetectorBench",Y=str((118.0-beg)*1.2e-3)) • in the procedure “getSpecular”. Is it OK? • 3) What is the correct angle for q=2.3° do we need to apply a slight offset ? • I may have found a bug in mantid. After loading the raw data into a workspace using “Load RAW file” command in Mantid, the data can be displayed in an image or a plot like Fig. 6. But the spectrum number is not consistent with each other.
1st angle (q=0.5°) Fig. 1 Images of straight through beam 2nd angle (q=1.6°) 10 mA, Slit area=10 (#4986) 116 110 Channel number 3rd angle (q=2.3°)
Fig. 2 Profiles of straight through beam nr.get.mergeThroughBeams("05TB",[4985],[4986],0.03,7.0,106,112) nr.get.mergeThroughBeams("16TB",[4987],[4988],0.03,7.0,106,112) nr.get.mergeThroughBeams("23TB",[4989],[4990],0.03,7.0,106,112) Slit conditions
Fig. 3 Images of reflected beam 2nd angle (q=1.6°) 1st angle (q=0.5°) 116 110
Fig. 4 Profiles of reflected beam (1st angle). 3ch data (107-109) looks fine
Fig. 4 Profiles of reflected beam (2nd angle). 4ch data (107-110) looks fine
Fig. 5 Combined reflectivity curves 1st / 2nd 9ch / 9ch 3ch / 4ch
Fig. 6 3D plot and 2D plot of a workspace loaded by Load RAW File command. Spectrum number seems not to be consistent with each other.
Reflectivities of bilayer samples (spin-coat, F8BT/diL216/Si)