Download
1 / 65
660 likes | 840 Views
Heat Pump Research Project. Sponsored by the Heat Pump Working Group June 7, 2005. Project Goals. Assess energy use and savings from heat pumps installed under C&RD/ConAug and EWEB. Assess base case installation practices.

E N D
Heat Pump Research Project Sponsored by the Heat Pump Working Group June 7, 2005
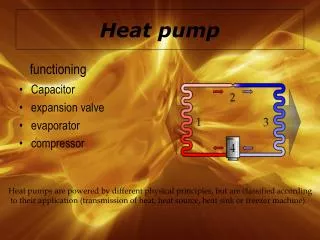
Project Goals • Assess energy use and savings from heat pumps installed under C&RD/ConAug and EWEB. • Assess base case installation practices. • Assess heat pump performance under laboratory conditions to identify optimal settings. • Assess the general approach of installers to control, sizing and performance issues, and of manufacturers to new technologies, etc.
C&RD / ConAug Billing Analysis Results Revised Results Previous Results
C&RD SF Cases NAC Saved by System C&RD MH Cases NAC Saved by System Type with 90% C.L., n= 549 Type with 90% C.L., n= 124 9,000 10,000 9,000 8,000 8,000 7,000 7,000 6,000 6,000 kWh/year 5,000 kWh/year 5,000 4,000 4,000 3,000 3,000 2,000 2,000 1,000 1,000 0 0 Zonal Zonal Heat Pump FAF w/CAC Heat Pump FAF w/CAC FAF w/oCAC All C&RD SF All SysTypes All SysTypes All C&RD MF FAF w/oCAC Billing Analysis Results by Building Type
MH NAC Saved with 90% C.L. by Vintage Bin, n= 114 7,000 6,000 5,000 4,000 kWh/year 3,000 2,000 1,000 0 1 2 3 All C&RD Billing Analysis Results by Vintage Legend: 1 Pre 1981 2 1981 – 1994 3 Post 94
Summary of Lab Results • Impacts of refrigerant charge minimal except at very reduced levels (70% of specification) • Impacts of air flow also limited to cases with very low air handler flow (less than 300 CFM/ton). • Low air flow appears to occur in about 25% of “base case” installation practice • TXV improves overall performance but has minimal impacts on the effects of low charge and low air flow • Cd higher than modeling assumptions for fixed orifice, lower than assumption for TXV • Defrost degradation factors largely stable at values near the modeled and manufacturer’s assumptions.
Field Study Overview • 160 field sites in 4 regions (Central Oregon, Kitsap Peninsula, Clark Co., Yakima/Walla Walla) started September 2004 • “Base case” sites, chosen at random to represent non-PTCS installations • Combine field findings with billing data to recalibrate performance assumptions used in RTF calculations • On-site review consists of two visits • Duct/house review (complete) • Heat pump review by service tech. (110 sites now in, additional 15 sites expected)
Site Selection • Sites selected via random telephone dial to have air-source heat pump and be within appropriate utility territory • Sites might have basements/interior ducts • Clark County chosen vs. Portland because of paucity of HPs in PDX Pacific Power svc territory • Clark actually has HP inspection program so non-typical vs other areas
Key Audit Outputs(house/duct) • House heat loss rate (UA) • Integral part of modeling house performance vs bills • Includes infiltration component (blower door test) • System airflow (CFM) • System capacity & efficiency • Duct system insulation and leakage • System operating pressures also measured • Duct leakage fraction (%) • Effect on overall delivery efficiency/energy use • Homeowner interaction with system (via survey)
Key Audit Outputs (heat pump review) • HP control strategy • Indoor thermostat type, setting and staging • Outdoor thermostat presence, setting and operation • Compressor low ambient cut out • Refrigerant charge level
Blower Door Results • Median ACH50 is 7.6 for 149 clean cases; mean is 8.3 • This converts to median ACHnat of 0.38 • Highest ACH50 19.0 • Lowest ACH50 1.6
Duct Leakage by Vintage Bin Supply Side Return Side
System Fan Flow • Median flow is 340 CFM/ton (n=126) • Lower quartile is <=292 CFM/ton • ECM cases (n=21*), median flow is 338 CFM/ton *final # will be larger
Refrigerant Charge Evaluation • Review predominantly done in swing seasons • Heating season evaluation combined tech’s review of operating pressures and sensible split in context of ambient temp., system airflow, coil match • About 1/3 of systems evaluated in cooling only mode or in addition to heating mode • Superheat/subcooling evaluation
Charge Results • 60% of cases evaluated as having correct charge • 28% of cases evaluated as being overcharged • 10% of cases evaluated as being undercharged • 2 had serious leaks (no refrigerant)
Refrigerant Charge Digest • Over/undercharge amounts likely under-reported vs weigh-in approach • However, cases of severe undercharge were very limited • ½ of overcharged cases had an accumulator • 2/3 of remaining overcharged cases were units with Trane compressors or scroll compressors
Heat Pump Efficiency HSPF by Region HSPF by Equipment Size
HVAC Usage(from median low bill analysis of 124 bills) Heating - Annual kWh Cooling - Annual kWh
Normalized Heating Load by Vintage and Region Heating - Annual kWh/sf Total Usage - Annual kWh/sf
Normalized Heating Usage Impact of wood – Annual kWh/sf Percentage of Sample Using Wood
Modeled Duct Efficiency(efficiency of 1 is perfect ducts) By Region By Vintage
Duct Insulation Supply vs. Return UA R-Value of Supply Ducts
Thermostat/Homeowner Interaction • ~80% of systems have programmable stats… • ~1/3 of occupants say they understand their thermostat and/or like how it keeps their house comfortable • ~1/3 say they tolerate their thermostat (but wish they understood it better) • ~1/3 have thrown up their hands and use the HOLD feature
Controls: Indoor Thermostat • 78% programmable • Median heating setpoint: 70 F • Median setback: 65 F • 55% of systems with setback > 5 F • Estimated 75% of programmable stats have adaptive recovery
Controls: Outdoor Thermostat • About 35% of sites visited had an operating ODT (75% of Clark sites have ODT) • Average setting 40° F • About 2/3 of sites without ODTs had the extra wires needed to install one without fishing new wire • Only 15% of systems had elements on in Stage 1 heating • Median on-time 5 minutes
HVAC Installer Interviews(detailed results) • 32 shops throughout region in urban, suburban, rural areas (29 full interviews) • Shops range from 2 trucks to 30, median of 6 • Median 50% new construction • Participants install all major (and some secondary) brands of equipment • Almost all participants report use of non-intuitive heat pump and duct sizing tools (Manual J, Manual D, etc.) • Wide range of experience with utility, state, national incentive/marketing campaigns and installation procedures