Download
1 / 1
10 likes | 97 Views
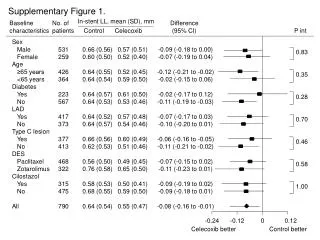
Supplementary Figure 1 displaying in-stent LL (mean, SD) in mm and baseline characteristics of 531 patients, highlighting differences between control and celecoxib groups. Data includes sex, age, diabetes, LAD, type C lesion, and DES usage.

E N D
Supplementary Figure 1. In-stent LL, mean (SD), mm Baseline characteristics No. of patients Difference (95% CI) Control Celecoxib P int Sex Male Female Age ≥65 years <65 years Diabetes Yes No LAD Yes No Type C lesion Yes No DES Paclitaxel Zotarolimus Cilostazol Yes No All 531 259 426 364 223 567 417 373 377 413 468 322 315 475 790 0.66 (0.56) 0.57 (0.51) 0.60 (0.50) 0.52 (0.40) 0.64 (0.55) 0.52 (0.45) 0.64 (0.54) 0.59 (0.50) 0.64 (0.57) 0.61 (0.50) 0.64 (0.53) 0.53 (0.46) 0.64 (0.52) 0.57 (0.48) 0.64 (0.57) 0.54 (0.46) 0.66 (0.56) 0.60 (0.49) 0.62 (0.53) 0.51 (0.46) 0.56 (0.50) 0.49 (0.45) 0.76 (0.58) 0.65 (0.50) 0.58 (0.53) 0.50 (0.41) 0.68 (0.55) 0.59 (0.50) 0.64 (0.54) 0.55 (0.47) -0.09 (-0.18 to 0.00) -0.07 (-0.19 to 0.04) -0.12 (-0.21 to -0.02) -0.02 (-0.15 to 0.06) -0.02 (-0.17 to 0.12) -0.11 (-0.19 to -0.03) -0.07 (-0.17 to 0.03) -0.10 (-0.20 to 0.01) -0.06 (-0.16 to -0.05) -0.11 (-0.21 to -0.02) -0.07 (-0.15 to 0.02) -0.11 (-0.23 to 0.01) -0.09 (-0.19 to 0.02) -0.09 (-0.18 to 0.01) -0.08 (-0.16 to -0.01) 0.83 0.35 0.28 0.70 0.46 0.58 1.00 -0.24 -0.12 0 0.12 Celecoxib better Control better