Download

1 / 10
100 likes | 314 Views
Annuities and Present Value. Continuing our analysis of the time value of money. Revised by DBH 1/2006. Scenario. You are age 35 today and you start to think for the first time about retirement.

E N D
Annuities and Present Value Continuing our analysis of the time value of money. Revised by DBH 1/2006
Scenario • You are age 35 today and you start to think for the first time about retirement. • You calculate a careful budget and find you have only $100 per month you can set aside for retirement savings. Is it even worth it? • Suppose we can invest in an investment fund that historically pays an average rate of 8% • Let’s do the math
Do the Math (#1) With disciplined investing, you could accumulate a fund of $149,000+ depositing only $100 per month at 8%. (Many securities funds have historically done better than 8%)
How much do I need now for later? • Suppose you’ve done that for 30 years and have accumulated your fund. • You determine you need $1,200 per month over your Social Security to survive in retirement. If you expect to live 20 more years (to age 85) can you do it on your little fund?
Do the Math #2 You should have little trouble living for 20 years with your retirement fund provided you are a disciplined investor and spender.
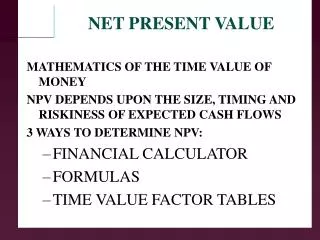
Net Present Value • Businesses must make the same kinds of decisions we look at as individuals. • They decide whether or not to invest in a project that will pay off gradually, over a period of years. • But often, in these analyses, the cash flows from these investments are not always equal—they may increase or decrease as time passes • This can be measured using a tool called Net Present Value (NPV function in Excel)—this is explored in ch. 9.
A Simple Illustration of NPV • Let’s assume a new project costs $1 million in initial capital investment on a given date (we’ll call this Year 0). • Over the next five years (Years 1 through 5), the project is projected to produce $280 K in annual new cash flow to the firm ($1.4 mil. over its life) • Our “hurdle rate” (cost of capital) is 12%--we must earn at least 12% on any new investment to satisfy our stockholders • Should we do the project?
Excel NPV calculation • The NPV function in Excel calculates the present value today of the cash flows for the next five years (discounted at 12%) • Result= the project has a small positive NPV and can be approved. (It will earn at least 12%)
Suppose cash flows are uneven? • Suppose the cash flows were “uneven” but did better later in the project? Total cash flows are identical ( $1.4 million) • Still a good idea? • Not necessarily—in the case at right the NPV is negative—it won’t earn 12% over its life. • The earlier we can recover our cost, the more likely we’ll meet our hurdle rate.
More to come • We’ll explore this concept a bit more in Chapter Nine and also illustrate a method of estimating the projected rate of return for a given project (Internal Rate of Return or IRR) • The present value calculations would be a challenge to do by hand, but are easy using computerized financial functions.