Download
1 / 25
250 likes | 320 Views
Correlation between variables. Remember linear regression techniques? Let’s take a few moments and consider the evaluation of the minimization criterion used to obtain the “best fit” line. y = mx + b.

E N D
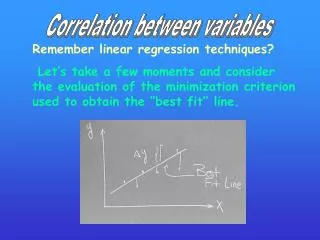
Correlation between variables Remember linear regression techniques? Let’s take a few moments and consider the evaluation of the minimization criterion used to obtain the “best fit” line.
y = mx + b The best fit line is a line which minimizes the difference between the estimated and actual values of y.
is the estimate of yi. We want to minimize these differences for all yi.
.. and the best way to do this is to minimize the sum of the squares of these departures. Mathematically the sum of the squares of the departures or differences is Let the sum of these differences = D. How can we minimize D?
Remember, when you want to find the minimum of something you compute its derivative (its tangents) and set the derivative equal to 0, i.e., find a tangent to the curve whose slope is zero. Where is the minimum of the function ?
Given there are two ways we could minimize this expression - one with respect to the slope m - and the other with respect to the intercept b. We’ll work through a little of this on the board
Differentiation w.r.t. m and b yield The result yields two linear equations in two unknowns that can be combined to evaluate the slope m and intercept b of the best fit line.
The end result - The intercept The slope Where s2=variance of x
It also turns out that Where the covariance between x and y is or
AVIRIS 224 spectral measurements per pixel
Airborne Visible and Infrared Imaging Spectroscope Think of the AVIRIS data set as consisting of 224 images of the same area each recorded at different wavelengths extending from the 400 to 2500 nanometer (0.4 to 2.5 micron) range. MicroImages, Inc. TNTlite
Kaolinite Spectral characteristics of different minerals serve as fingerprints that can be used to identify the mineral from which light has been reflected. Alunite Chalcedony
Color composite photo of the Cuprite Nevada area derived from three Landsat TM bands. For more information about these remote sensing methods, visit http://speclab.cr.usgs.gov/ map.intro.html
Another image derived from a combination of Landsat bands. Mineral distributions are suggested by the color distribution but are not uniquely associated with individual mineral types.
This image is compiled from the hyperspectral AVIRIS data. The different colors are associated with the distribution of specific minerals across the surface.
To determine what mineral a specific spectral signature represents, one must make comparisons to know mineral spectra. See the USGS spectral library at http://speclab.cr.usgs.gov/spectral-lib.html
From the AVIRIS image From the USGS spectral library.
Region 1 Region 2 Region 4 Region 3 Some AVIRIS data extracted for a class exercise Individual pixels defined by a given value of reflectance Band 20 - 0.57 microns ~ TM band 2
1 2 4 3 Band 100 - 1.28 microns
Band 200 - 2.27 microns ~ TM band 7